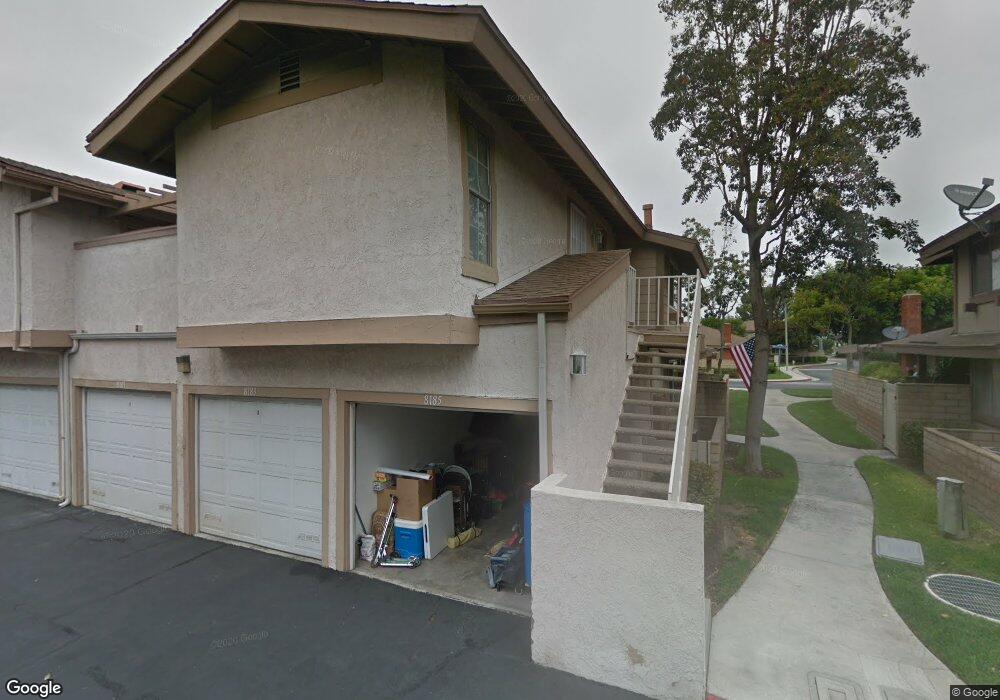
8185 Woodland Dr Unit 46 Buena Park, CA 90620
Estimated Value: $542,427 - $728,000
2
Beds
2
Baths
1,039
Sq Ft
$600/Sq Ft
Est. Value
About This Home
This home is located at 8185 Woodland Dr Unit 46, Buena Park, CA 90620 and is currently estimated at $623,607, approximately $600 per square foot. 8185 Woodland Dr Unit 46 is a home located in Orange County with nearby schools including Dr. Peter Marshall Elementary School, Brookhurst Junior High School, and Savanna High School.
Ownership History
Date
Name
Owned For
Owner Type
Purchase Details
Closed on
Jun 17, 2013
Sold by
Leblanc Michael Joseph and Leblanc Sandra Frances
Bought by
Leblanc Sandra Frances and Leblanc Michael Joseph
Current Estimated Value
Home Financials for this Owner
Home Financials are based on the most recent Mortgage that was taken out on this home.
Original Mortgage
$137,100
Outstanding Balance
$97,046
Interest Rate
3.38%
Mortgage Type
New Conventional
Estimated Equity
$526,561
Purchase Details
Closed on
Nov 10, 1999
Sold by
Thompson Linda L
Bought by
Leblanc Michael Joseph and Leblanc Sandra Frances
Home Financials for this Owner
Home Financials are based on the most recent Mortgage that was taken out on this home.
Original Mortgage
$121,000
Interest Rate
7.96%
Purchase Details
Closed on
Mar 6, 1995
Sold by
Thompson Terry W
Bought by
Thompson Linda L
Create a Home Valuation Report for This Property
The Home Valuation Report is an in-depth analysis detailing your home's value as well as a comparison with similar homes in the area
Home Values in the Area
Average Home Value in this Area
Purchase History
| Date | Buyer | Sale Price | Title Company |
|---|---|---|---|
| Leblanc Sandra Frances | -- | Chicago Title Company | |
| Leblanc Michael Joseph | $134,500 | -- | |
| Thompson Linda L | -- | -- |
Source: Public Records
Mortgage History
| Date | Status | Borrower | Loan Amount |
|---|---|---|---|
| Open | Leblanc Sandra Frances | $137,100 | |
| Closed | Leblanc Michael Joseph | $121,000 |
Source: Public Records
Tax History Compared to Growth
Tax History
| Year | Tax Paid | Tax Assessment Tax Assessment Total Assessment is a certain percentage of the fair market value that is determined by local assessors to be the total taxable value of land and additions on the property. | Land | Improvement |
|---|---|---|---|---|
| 2025 | $2,502 | $206,710 | $102,673 | $104,037 |
| 2024 | $2,502 | $202,657 | $100,659 | $101,998 |
| 2023 | $2,435 | $198,684 | $98,685 | $99,999 |
| 2022 | $2,405 | $194,789 | $96,750 | $98,039 |
| 2021 | $2,376 | $190,970 | $94,853 | $96,117 |
| 2020 | $2,361 | $189,012 | $93,880 | $95,132 |
| 2019 | $2,306 | $185,306 | $92,039 | $93,267 |
| 2018 | $2,277 | $181,673 | $90,234 | $91,439 |
| 2017 | $2,200 | $178,111 | $88,464 | $89,647 |
| 2016 | $2,186 | $174,619 | $86,729 | $87,890 |
| 2015 | $2,163 | $171,997 | $85,427 | $86,570 |
| 2014 | $2,059 | $168,628 | $83,753 | $84,875 |
Source: Public Records
Map
Nearby Homes
- 8213 Woodland Dr Unit 40
- 8319 Hickory Dr
- 605 N La Reina St
- 2544 W Greenacre Ave
- 2625 W Cameron Ct Unit 121
- 1006 N Hampton Place
- 8434 Periwinkle Dr
- 1028 N Mayflower St
- 2709 W Madison Cir
- 21 Centerstone Cir
- 400 N Syracuse St
- 2697 W Parkside Ln
- 728 N Geneva St
- 525 N Gilbert St Unit 106
- 525 N Gilbert St Unit 151
- 1012 N Doria St
- 199 N Magnolia Ave Unit B
- 8098 Lime Cir
- 2540 W Picadilly Way
- 8452 Stanton Ave
- 8187 Woodland Dr
- 2677 W Greenbrier Ave
- 2673 W Greenbrier Ave
- 2669 W Greenbrier Ave
- 939 N La Reina St
- 2665 W Greenbrier Ave
- 935 N La Reina St
- 8000 Woodland Dr Unit 1
- 8173 Woodland Dr Unit 52
- 8125 Woodland Dr Unit 71
- 8004 Woodland Dr Unit 2
- 8006 Woodland Dr Unit 4
- 8215 Woodland Dr Unit 38
- 8175 Woodland Dr Unit 50
- 8135 Woodland Dr Unit 67
- 8175 Woodland Dr
- 8217 Woodland Dr Unit 39
- 8133 Woodland Dr Unit 68
- 8199 Woodland Dr Unit 41
- 8040 Woodland Dr