Estimated Value: $379,000 - $589,731
4
Beds
2
Baths
2,574
Sq Ft
$191/Sq Ft
Est. Value
About This Home
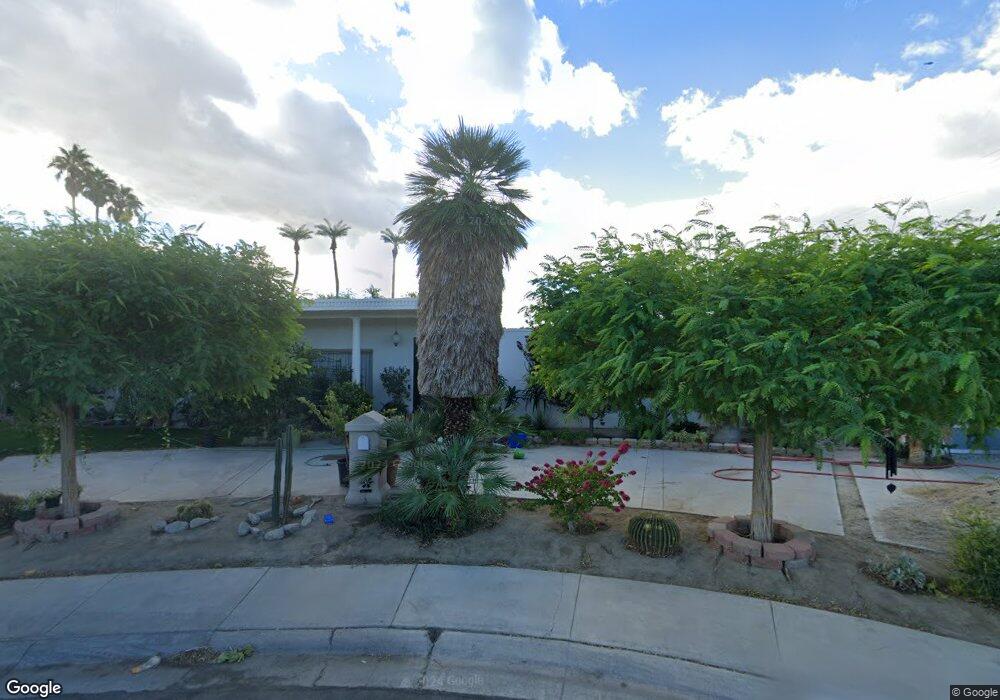
This home is located at 81867 Tournament Way, Indio, CA 92201 and is currently estimated at $492,183, approximately $191 per square foot. 81867 Tournament Way is a home located in Riverside County with nearby schools including Lyndon B. Johnson Elementary School, Indio Middle School, and Indio High School.
Ownership History
Date
Name
Owned For
Owner Type
Purchase Details
Closed on
Aug 31, 2015
Sold by
Silvermon Entities
Bought by
Balderas Edward and Balderas Angie
Current Estimated Value
Home Financials for this Owner
Home Financials are based on the most recent Mortgage that was taken out on this home.
Original Mortgage
$204,231
Outstanding Balance
$160,355
Interest Rate
3.9%
Mortgage Type
FHA
Estimated Equity
$331,828
Purchase Details
Closed on
Apr 15, 2015
Sold by
Robinson Byron M and Robinson Mary Jane
Bought by
Silvermoon Entities
Purchase Details
Closed on
Nov 29, 2012
Sold by
Robinson Byron and Robinson Mary Jane
Bought by
Robinson Byron M and Robinson Mary Jane
Purchase Details
Closed on
Nov 16, 1999
Sold by
Marshburn Daniel R and Marshburn Candace R
Bought by
Robinson Byron and Robinson Mary Jane
Home Financials for this Owner
Home Financials are based on the most recent Mortgage that was taken out on this home.
Original Mortgage
$124,000
Interest Rate
7.87%
Mortgage Type
Purchase Money Mortgage
Create a Home Valuation Report for This Property
The Home Valuation Report is an in-depth analysis detailing your home's value as well as a comparison with similar homes in the area
Home Values in the Area
Average Home Value in this Area
Purchase History
| Date | Buyer | Sale Price | Title Company |
|---|---|---|---|
| Balderas Edward | $208,000 | Chicago Title Inland Empire | |
| Silvermoon Entities | $150,000 | None Available | |
| Robinson Byron M | -- | None Available | |
| Robinson Byron | $155,000 | Fidelity National Title Co |
Source: Public Records
Mortgage History
| Date | Status | Borrower | Loan Amount |
|---|---|---|---|
| Open | Balderas Edward | $204,231 | |
| Previous Owner | Robinson Byron | $124,000 |
Source: Public Records
Tax History Compared to Growth
Tax History
| Year | Tax Paid | Tax Assessment Tax Assessment Total Assessment is a certain percentage of the fair market value that is determined by local assessors to be the total taxable value of land and additions on the property. | Land | Improvement |
|---|---|---|---|---|
| 2025 | $4,007 | $246,222 | $61,554 | $184,668 |
| 2023 | $4,007 | $236,664 | $59,165 | $177,499 |
| 2022 | $3,984 | $232,024 | $58,005 | $174,019 |
| 2021 | $3,701 | $227,475 | $56,868 | $170,607 |
| 2020 | $3,368 | $225,143 | $56,285 | $168,858 |
| 2019 | $3,278 | $220,730 | $55,182 | $165,548 |
| 2018 | $3,103 | $216,402 | $54,100 | $162,302 |
| 2017 | $3,047 | $212,160 | $53,040 | $159,120 |
| 2016 | $2,994 | $208,000 | $52,000 | $156,000 |
| 2015 | $2,961 | $198,204 | $51,144 | $147,060 |
| 2014 | $2,916 | $194,324 | $50,144 | $144,180 |
Source: Public Records
Map
Nearby Homes
- 81723 Galahad Ln
- 44260 Monroe St Unit 54
- 0 Fred Waring Dr & Hoover St Unit 219115258
- 0 Indio Blvd Unit IV25187201
- 0 NW Fred Waring Hoover St Unit 219102015DA
- 82245 Sierra Ave
- 45546 Aladdin St Unit A101
- 81364 Monet Ct
- 82489 Valencia Ave
- 81436 Avenue 44 Unit 523
- 81194 Avenida Gonzalez
- 82950 California 111
- 82320 Kenner Ave
- 0 King St
- 82129 Crest Ave
- 44482 Avenida Suarez
- 83037 Avenue 44
- 81118 Pindo Dr
- 43595 King St
- 81351 Avenue 46 Unit 110
- 81887 Tournament Way
- 44728 Sherwood Dr
- 81860 Camelot Way
- 44700 Sherwood Dr
- 44756 Sherwood Dr
- 81880 Camelot Way
- 44682 Sherwood Dr
- 81907 Tournament Way
- 81880 Tournament Way
- 81860 Tournament Way
- 44 Sherwood Dr
- 81900 Camelot Way
- 44644 Sherwood Dr
- 81900 Tournament Way
- 44812 Sherwood Dr
- 81927 Tournament Way
- 44729 Sherwood Dr
- 44701 Sherwood Dr
- 81867 Camelot Way
- 44757 Sherwood Dr