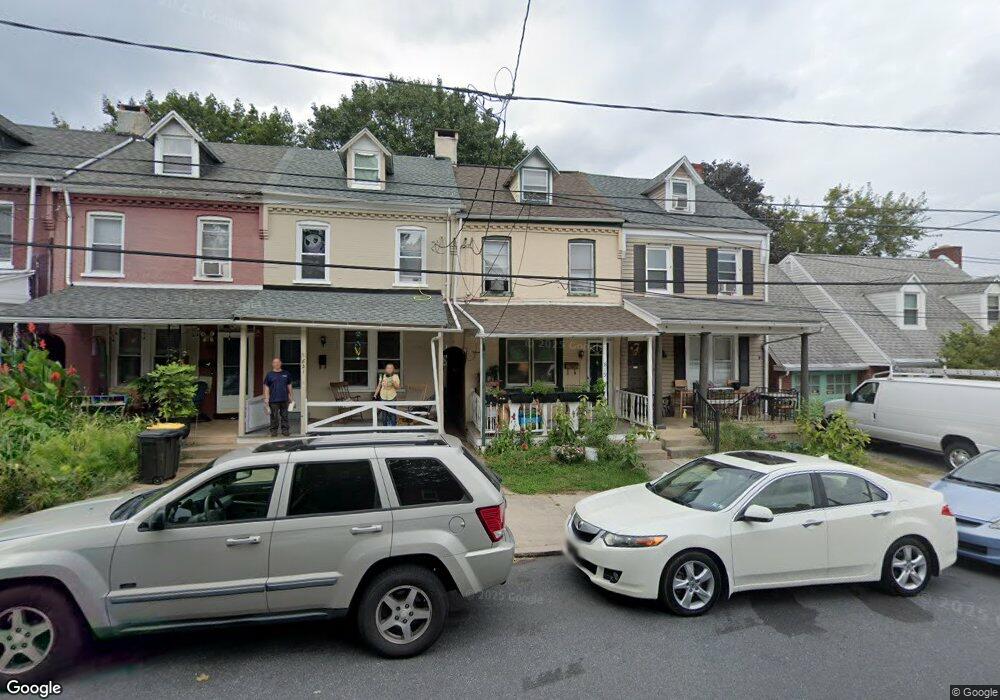
819 5th St Lancaster, PA 17603
West End NeighborhoodEstimated Value: $159,000 - $196,000
3
Beds
1
Bath
1,005
Sq Ft
$180/Sq Ft
Est. Value
About This Home
This home is located at 819 5th St, Lancaster, PA 17603 and is currently estimated at $180,980, approximately $180 per square foot. 819 5th St is a home located in Lancaster County with nearby schools including Smith-Wade-El Elementary School, Wheatland Middle School, and McCaskey High School.
Ownership History
Date
Name
Owned For
Owner Type
Purchase Details
Closed on
Jan 20, 2010
Sold by
Liss Jennifer Susan and Aten Jennifer S
Bought by
Willig Thomas S and Willig Judith A
Current Estimated Value
Home Financials for this Owner
Home Financials are based on the most recent Mortgage that was taken out on this home.
Original Mortgage
$50,625
Outstanding Balance
$33,407
Interest Rate
5.05%
Mortgage Type
New Conventional
Estimated Equity
$147,573
Purchase Details
Closed on
Jul 28, 2000
Sold by
Peters Nelson G and Peters Sherri L
Bought by
Liss Jennifer Susan
Home Financials for this Owner
Home Financials are based on the most recent Mortgage that was taken out on this home.
Original Mortgage
$56,050
Interest Rate
8.18%
Purchase Details
Closed on
Mar 21, 2000
Sold by
Hud
Bought by
Peters Nelson G and Peters Sherri L
Purchase Details
Closed on
Aug 27, 1998
Sold by
Cendant Mtg
Bought by
Hud
Create a Home Valuation Report for This Property
The Home Valuation Report is an in-depth analysis detailing your home's value as well as a comparison with similar homes in the area
Home Values in the Area
Average Home Value in this Area
Purchase History
| Date | Buyer | Sale Price | Title Company |
|---|---|---|---|
| Willig Thomas S | $67,500 | None Available | |
| Liss Jennifer Susan | $59,000 | -- | |
| Peters Nelson G | $35,322 | -- | |
| Hud | -- | -- |
Source: Public Records
Mortgage History
| Date | Status | Borrower | Loan Amount |
|---|---|---|---|
| Open | Willig Thomas S | $50,625 | |
| Previous Owner | Liss Jennifer Susan | $56,050 |
Source: Public Records
Tax History Compared to Growth
Tax History
| Year | Tax Paid | Tax Assessment Tax Assessment Total Assessment is a certain percentage of the fair market value that is determined by local assessors to be the total taxable value of land and additions on the property. | Land | Improvement |
|---|---|---|---|---|
| 2025 | $2,754 | $69,600 | $17,500 | $52,100 |
| 2024 | $2,754 | $69,600 | $17,500 | $52,100 |
| 2023 | $2,708 | $69,600 | $17,500 | $52,100 |
| 2022 | $2,595 | $69,600 | $17,500 | $52,100 |
| 2021 | $2,539 | $69,600 | $17,500 | $52,100 |
| 2020 | $2,539 | $69,600 | $17,500 | $52,100 |
| 2019 | $2,501 | $69,600 | $17,500 | $52,100 |
| 2016 | $2,740 | $60,200 | $15,700 | $44,500 |
| 2015 | $1,069 | $60,200 | $15,700 | $44,500 |
| 2014 | $2,391 | $60,200 | $15,700 | $44,500 |
Source: Public Records
Map
Nearby Homes