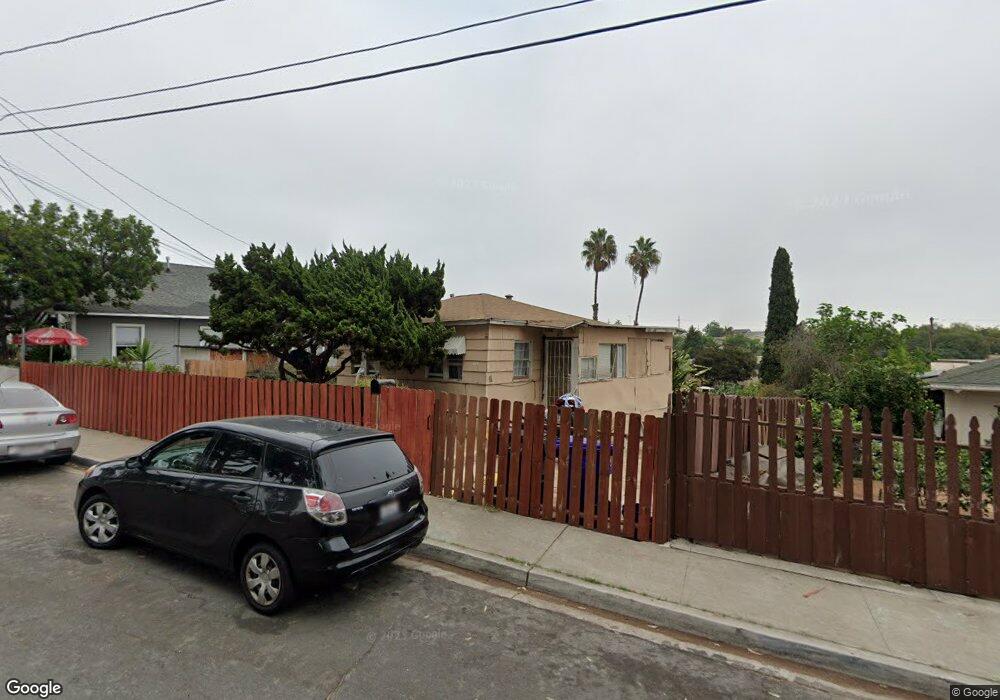
819 Boundary St San Diego, CA 92102
Mount Hope NeighborhoodEstimated Value: $530,919 - $657,000
1
Bed
1
Bath
480
Sq Ft
$1,217/Sq Ft
Est. Value
About This Home
This home is located at 819 Boundary St, San Diego, CA 92102 and is currently estimated at $584,230, approximately $1,217 per square foot. 819 Boundary St is a home located in San Diego County with nearby schools including Chollas/Mead Elementary School, Millennial Tech Middle School, and Lincoln High School.
Ownership History
Date
Name
Owned For
Owner Type
Purchase Details
Closed on
May 11, 2013
Sold by
Moreno Lucita G
Bought by
Moreno Lucita G
Current Estimated Value
Purchase Details
Closed on
Apr 4, 2013
Sold by
Moreno Anthony Gregorio
Bought by
Moreno Lucita Gregorio
Purchase Details
Closed on
Jun 25, 2012
Sold by
Moreno Mary Margaret
Bought by
Moreno Anthony Gregorio
Purchase Details
Closed on
Jun 18, 2012
Sold by
Moreno Lucita G
Bought by
Moreno Lucita G and Moreno Anthony
Create a Home Valuation Report for This Property
The Home Valuation Report is an in-depth analysis detailing your home's value as well as a comparison with similar homes in the area
Home Values in the Area
Average Home Value in this Area
Purchase History
| Date | Buyer | Sale Price | Title Company |
|---|---|---|---|
| Moreno Lucita G | -- | None Available | |
| Moreno Lucita Gregorio | -- | None Available | |
| Moreno Anthony Gregorio | -- | None Available | |
| Moreno Lucita G | -- | None Available |
Source: Public Records
Tax History Compared to Growth
Tax History
| Year | Tax Paid | Tax Assessment Tax Assessment Total Assessment is a certain percentage of the fair market value that is determined by local assessors to be the total taxable value of land and additions on the property. | Land | Improvement |
|---|---|---|---|---|
| 2025 | $596 | $46,569 | $21,730 | $24,839 |
| 2024 | $596 | $45,656 | $21,304 | $24,352 |
| 2023 | $582 | $44,762 | $20,887 | $23,875 |
| 2022 | $567 | $43,885 | $20,478 | $23,407 |
| 2021 | $563 | $43,026 | $20,077 | $22,949 |
| 2020 | $557 | $42,586 | $19,872 | $22,714 |
| 2019 | $547 | $41,752 | $19,483 | $22,269 |
| 2018 | $513 | $40,934 | $19,101 | $21,833 |
| 2017 | $501 | $40,132 | $18,727 | $21,405 |
| 2016 | $492 | $39,346 | $18,360 | $20,986 |
| 2015 | $485 | $38,756 | $18,085 | $20,671 |
| 2014 | $478 | $37,998 | $17,731 | $20,267 |
Source: Public Records
Map
Nearby Homes
- 1020 41st St
- 530 42nd St Unit 1 & 2
- 441-43 Morrison St
- 514 42nd St
- 3665 Ash St Unit 7
- 4264 Market St
- 3688 Cactusview Dr
- 4225 J St
- 0 36th St Unit 4 240028878
- 0 36th St Unit 3 240028877
- 1480 Bridgeview Dr
- 1505 Bridgeview Dr
- 282 Pardee St
- 0000 Pardee St Unit 2-4
- 0 Pardee Unit 2 240028875
- 821
- 3389-91 C St
- 3171 3175 K St
- 441 443 N 41st St
- 348 & 350 27th St