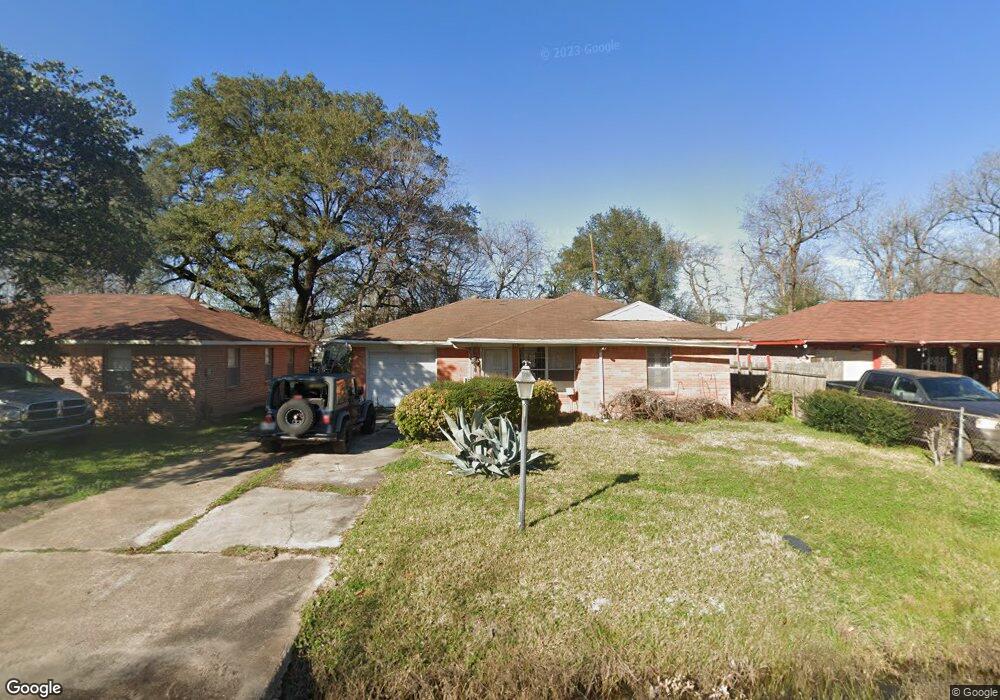
819 E 43rd St Houston, TX 77022
Independence Heights NeighborhoodEstimated Value: $179,000 - $194,000
3
Beds
1
Bath
929
Sq Ft
$205/Sq Ft
Est. Value
About This Home
This home is located at 819 E 43rd St, Houston, TX 77022 and is currently estimated at $190,189, approximately $204 per square foot. 819 E 43rd St is a home located in Harris County with nearby schools including Burrus Elementary School, Williams Middle, and Booker T Washington Sr High.
Ownership History
Date
Name
Owned For
Owner Type
Purchase Details
Closed on
Sep 6, 2024
Sold by
Murray Martha Seales
Bought by
Murray Martha Seales and Appelt Christina June
Current Estimated Value
Purchase Details
Closed on
Jun 4, 2009
Sold by
Fannie Mae
Bought by
Murray Martha
Purchase Details
Closed on
Feb 6, 2009
Sold by
Wells Fargo Bank Na
Bought by
Federal National Mortgage Association
Purchase Details
Closed on
Jan 6, 2009
Sold by
Powell Irene
Bought by
Wells Fargo Bank Na
Create a Home Valuation Report for This Property
The Home Valuation Report is an in-depth analysis detailing your home's value as well as a comparison with similar homes in the area
Home Values in the Area
Average Home Value in this Area
Purchase History
| Date | Buyer | Sale Price | Title Company |
|---|---|---|---|
| Murray Martha Seales | -- | None Listed On Document | |
| Murray Martha | -- | Texas American Title Company | |
| Federal National Mortgage Association | -- | Texas American Title Company | |
| Wells Fargo Bank Na | $74,026 | None Available |
Source: Public Records
Tax History
| Year | Tax Paid | Tax Assessment Tax Assessment Total Assessment is a certain percentage of the fair market value that is determined by local assessors to be the total taxable value of land and additions on the property. | Land | Improvement |
|---|---|---|---|---|
| 2025 | $4,085 | $209,561 | $167,738 | $41,823 |
| 2024 | $4,085 | $195,220 | $167,738 | $27,482 |
| 2023 | $4,085 | $186,739 | $149,100 | $37,639 |
| 2022 | $4,131 | $187,612 | $149,100 | $38,512 |
| 2021 | $3,593 | $154,180 | $118,038 | $36,142 |
| 2020 | $3,499 | $144,501 | $111,825 | $32,676 |
| 2019 | $2,572 | $101,661 | $55,913 | $45,748 |
| 2018 | $2,531 | $100,030 | $55,913 | $44,117 |
| 2017 | $2,058 | $81,392 | $37,275 | $44,117 |
| 2016 | $1,673 | $66,170 | $24,850 | $41,320 |
| 2015 | $1,624 | $66,170 | $24,850 | $41,320 |
| 2014 | $1,624 | $63,179 | $17,084 | $46,095 |
Source: Public Records
Map
Nearby Homes
- 821 Neyland St
- 606 E 42nd St
- 719 E 40th 1/2 St
- 4028 Cornell St
- 707 E 40th 1/2 St
- 610 E 41st St Unit A B
- 4208 Castor St Unit B
- 4208 Castor St Unit A
- 4206 Oxford St
- 821 Barkley St
- 727 E 40th St
- 508 Neyland St
- 3504 & 0 Cornell St
- 4303 Castor St
- 4043 Europa St
- 436 Neyland St Unit 1
- 819 E 40th St Unit A/B
- 4303 Castor Na St
- 3914 Ajax St
- 4220 Delhi St
Your Personal Tour Guide
Ask me questions while you tour the home.