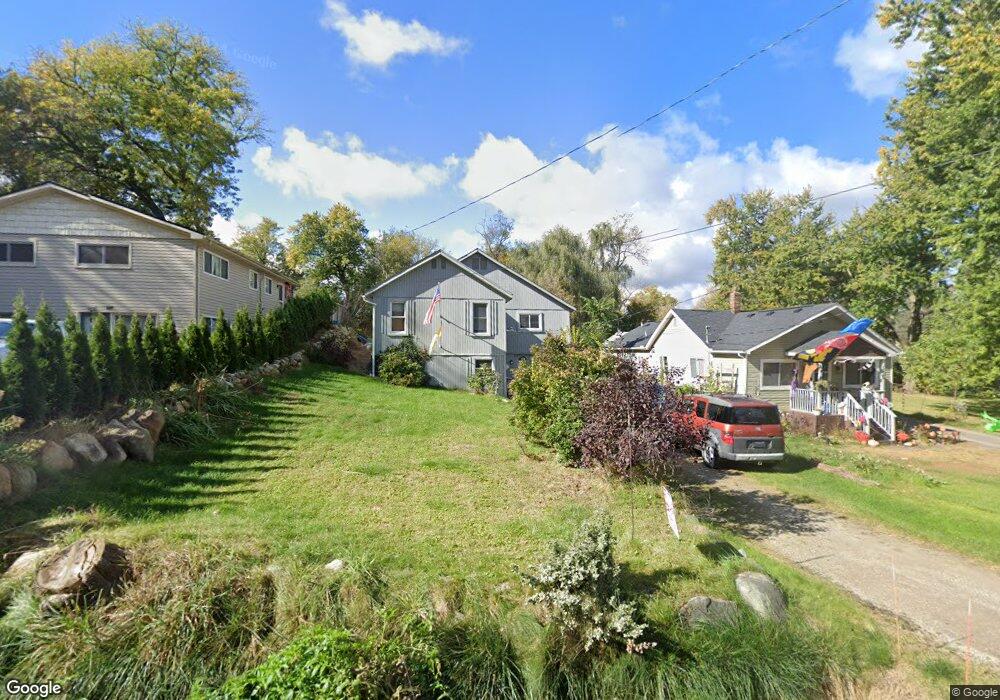
819 Elkinford Unit Bldg-Unit White Lake, MI 48383
Estimated Value: $215,000 - $305,000
4
Beds
2
Baths
905
Sq Ft
$286/Sq Ft
Est. Value
About This Home
This home is located at 819 Elkinford Unit Bldg-Unit, White Lake, MI 48383 and is currently estimated at $258,388, approximately $285 per square foot. 819 Elkinford Unit Bldg-Unit is a home located in Oakland County with nearby schools including St. Patrick School.
Ownership History
Date
Name
Owned For
Owner Type
Purchase Details
Closed on
Feb 21, 2018
Sold by
Potter Alyssa and Ryans Darrien
Bought by
Walli Eric and Walli Wayne
Current Estimated Value
Home Financials for this Owner
Home Financials are based on the most recent Mortgage that was taken out on this home.
Original Mortgage
$89,000
Outstanding Balance
$75,375
Interest Rate
3.99%
Mortgage Type
New Conventional
Estimated Equity
$183,013
Purchase Details
Closed on
Jul 21, 2016
Sold by
Equity Trust
Bought by
Potter Alyssa and Ryans Darrien
Home Financials for this Owner
Home Financials are based on the most recent Mortgage that was taken out on this home.
Original Mortgage
$124,208
Interest Rate
3.45%
Purchase Details
Closed on
Apr 25, 2016
Sold by
Equity Trust Company
Bought by
Potter Alyssa and Ryans Darrien
Purchase Details
Closed on
Jul 9, 2015
Sold by
Jackson Scott W
Bought by
Equity Trust Company and Jeremy Pelton Ira
Create a Home Valuation Report for This Property
The Home Valuation Report is an in-depth analysis detailing your home's value as well as a comparison with similar homes in the area
Home Values in the Area
Average Home Value in this Area
Purchase History
| Date | Buyer | Sale Price | Title Company |
|---|---|---|---|
| Walli Eric | $129,000 | Liberty Title | |
| Potter Alyssa | -- | -- | |
| Potter Alyssa | $126,500 | Fat | |
| Equity Trust Company | -- | A S K Services Inc |
Source: Public Records
Mortgage History
| Date | Status | Borrower | Loan Amount |
|---|---|---|---|
| Open | Walli Eric | $89,000 | |
| Previous Owner | Potter Alyssa | $124,208 | |
| Previous Owner | Potter Alyssa | -- |
Source: Public Records
Tax History Compared to Growth
Tax History
| Year | Tax Paid | Tax Assessment Tax Assessment Total Assessment is a certain percentage of the fair market value that is determined by local assessors to be the total taxable value of land and additions on the property. | Land | Improvement |
|---|---|---|---|---|
| 2024 | $1,511 | $87,130 | $0 | $0 |
| 2023 | $1,441 | $77,820 | $0 | $0 |
| 2022 | $2,310 | $71,190 | $0 | $0 |
| 2021 | $2,164 | $66,810 | $0 | $0 |
| 2020 | $1,320 | $62,310 | $0 | $0 |
| 2019 | $2,100 | $57,150 | $0 | $0 |
| 2018 | $2,004 | $54,100 | $0 | $0 |
| 2017 | $1,961 | $54,100 | $0 | $0 |
| 2016 | $1,795 | $48,840 | $0 | $0 |
| 2015 | -- | $40,390 | $0 | $0 |
| 2014 | -- | $31,470 | $0 | $0 |
| 2011 | -- | $32,160 | $0 | $0 |
Source: Public Records
Map
Nearby Homes
- V/L Highland Rd
- 609 Elkinford
- VL Lake Ln
- 685 Sunset
- 890 Beachway Dr
- 343 Teggerdine Trail
- 7600 Haley Rd
- 909 Nordic Dr
- 905 Nordic Dr
- 7135 Capri Dr
- 6404 Pennington Dr Unit 6
- 000 Highland Rd
- 880 Artdale Dr
- 590 Bogie Lake Rd
- 10217 Lakeside Dr
- 4813 Parkside Ln
- 0000 Highland
- Lot 70 Biscayne Dr
- 10379 Northridge Ct
- 969 Bogie Lake Rd