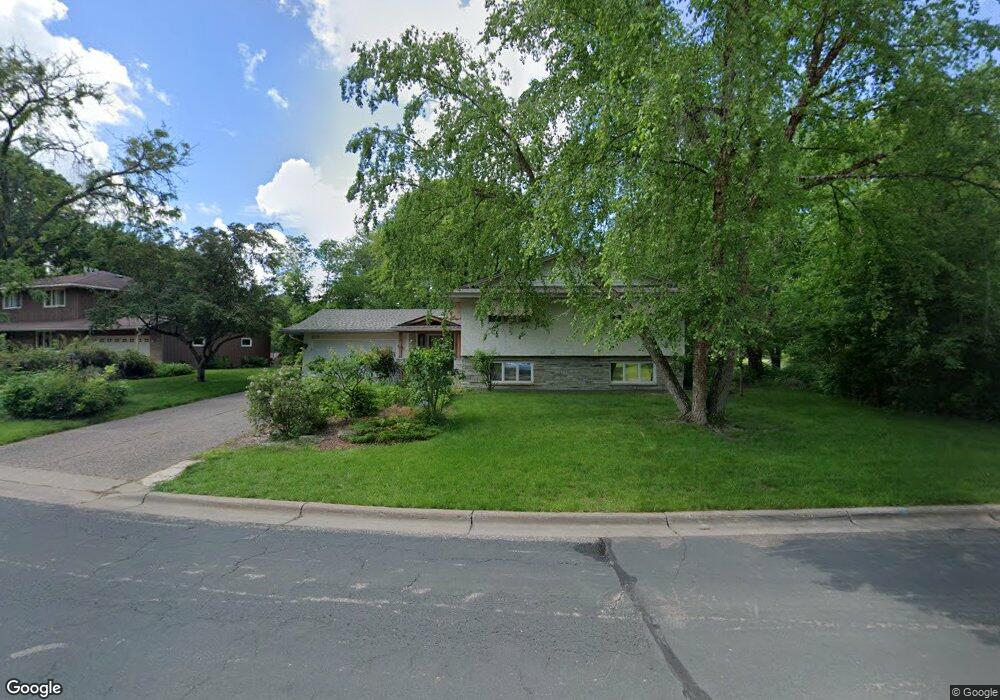
819 Everett Dr Stillwater, MN 55082
Estimated Value: $500,000 - $587,000
4
Beds
3
Baths
2,508
Sq Ft
$214/Sq Ft
Est. Value
About This Home
This home is located at 819 Everett Dr, Stillwater, MN 55082 and is currently estimated at $536,378, approximately $213 per square foot. 819 Everett Dr is a home located in Washington County with nearby schools including Lily Lake Elementary School, Stillwater Middle School, and Stillwater Area High School.
Ownership History
Date
Name
Owned For
Owner Type
Purchase Details
Closed on
Jul 15, 2022
Sold by
Roeder Susan
Bought by
Cote Steve
Current Estimated Value
Home Financials for this Owner
Home Financials are based on the most recent Mortgage that was taken out on this home.
Original Mortgage
$355,179
Outstanding Balance
$335,928
Interest Rate
5.09%
Mortgage Type
New Conventional
Estimated Equity
$200,450
Purchase Details
Closed on
Jul 12, 2022
Sold by
Roeder Susan M
Bought by
Cote Steve A
Home Financials for this Owner
Home Financials are based on the most recent Mortgage that was taken out on this home.
Original Mortgage
$355,179
Outstanding Balance
$335,928
Interest Rate
5.09%
Mortgage Type
New Conventional
Estimated Equity
$200,450
Purchase Details
Closed on
May 1, 2020
Sold by
Wilhelmi Michael S
Bought by
Roeder Susan M
Purchase Details
Closed on
May 6, 2019
Sold by
Wilhelmi Michael S and Roeder Susan M
Bought by
Roeder Susan M
Home Financials for this Owner
Home Financials are based on the most recent Mortgage that was taken out on this home.
Original Mortgage
$310,337
Interest Rate
4.4%
Mortgage Type
FHA
Purchase Details
Closed on
Jun 12, 2003
Sold by
Molnar Sasun T
Bought by
Wilhelmi Michael S and Roeder Susan M
Create a Home Valuation Report for This Property
The Home Valuation Report is an in-depth analysis detailing your home's value as well as a comparison with similar homes in the area
Home Values in the Area
Average Home Value in this Area
Purchase History
| Date | Buyer | Sale Price | Title Company |
|---|---|---|---|
| Cote Steve | $517,000 | -- | |
| Cote Steve A | $517,000 | Burnet Title | |
| Roeder Susan M | -- | None Available | |
| Roeder Susan M | $500 | None Available | |
| Wilhelmi Michael S | $346,000 | -- |
Source: Public Records
Mortgage History
| Date | Status | Borrower | Loan Amount |
|---|---|---|---|
| Open | Cote Steve | $355,179 | |
| Closed | Cote Steve A | $355,179 | |
| Previous Owner | Roeder Susan M | $310,337 |
Source: Public Records
Tax History
| Year | Tax Paid | Tax Assessment Tax Assessment Total Assessment is a certain percentage of the fair market value that is determined by local assessors to be the total taxable value of land and additions on the property. | Land | Improvement |
|---|---|---|---|---|
| 2024 | $5,374 | $464,900 | $130,000 | $334,900 |
| 2023 | $5,374 | $477,000 | $152,800 | $324,200 |
| 2022 | $6,232 | $447,500 | $152,800 | $294,700 |
| 2021 | $4,382 | $380,800 | $130,000 | $250,800 |
| 2020 | $4,194 | $361,900 | $120,000 | $241,900 |
| 2019 | $4,148 | $361,800 | $120,000 | $241,800 |
| 2018 | $4,126 | $340,500 | $115,000 | $225,500 |
| 2017 | $4,050 | $331,000 | $120,000 | $211,000 |
| 2016 | $4,822 | $319,100 | $110,000 | $209,100 |
| 2015 | $4,812 | $304,600 | $106,800 | $197,800 |
| 2013 | -- | $251,100 | $90,500 | $160,600 |
Source: Public Records
Map
Nearby Homes
- 811 Everett Dr
- 1953 Eastridge Ct
- 719 Victoria Ct
- XXX Industrial Blvd
- TBD Odell Ave N
- 308 4th St S
- 418 Holcombe St S
- 5862 Oakgreen Ct N
- 211 Olive St W
- 1515 Benson Blvd W
- 14281 57th St N
- xxxx Ramsey St W
- 109 Pine St E
- 123 Pine St E
- 14334 Upper 56th St N
- 1534 Cottage Dr
- 615 Rice St W
- 612 Rice St W
- 114 Brick St S Unit 103
- 14775 Upper 56th St N
- 817 Everett Dr
- 1316 Everett St S
- 1315 1315 Everett-Street-s
- 812 Everett Dr
- 814 Everett Dr
- 815 Everett Dr
- 810 Everett Dr
- 1312 Everett St S
- 1315 Everett St S
- 805 Orleans St W
- 813 Everett Dr
- 808 Everett Dr
- 1311 Everett St S
- 1308 Everett St S
- 806 Everett Dr
- 803 Orleans St W
- 803 803 Orleans-Street-w
- 1307 Everett St S
- 1306 Everett St S
- 804 Everett Dr
Your Personal Tour Guide
Ask me questions while you tour the home.