
Seller's Agent in 2015
Danielle Groeneweg
RE/MAX
(360) 483-6490
51 in this area
112 Total Sales

Estimated Value: $1,035,000 - $1,343,000
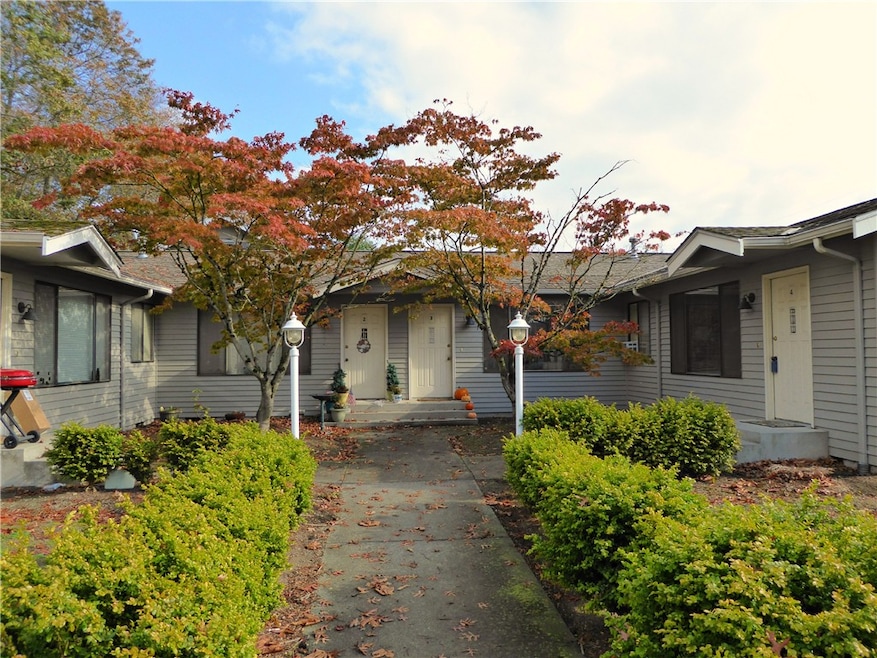
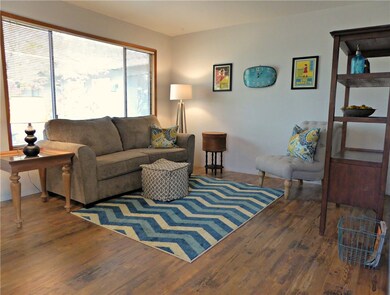
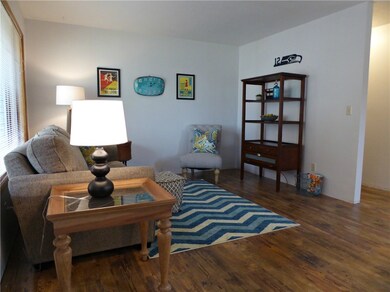
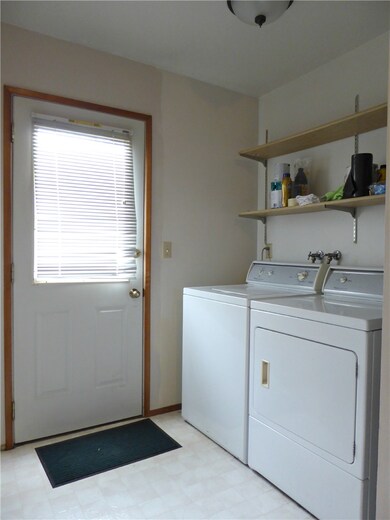
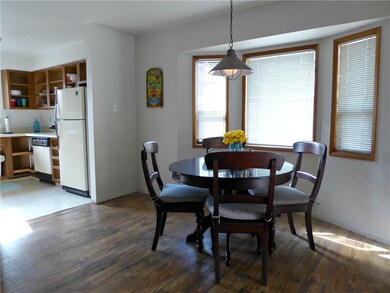
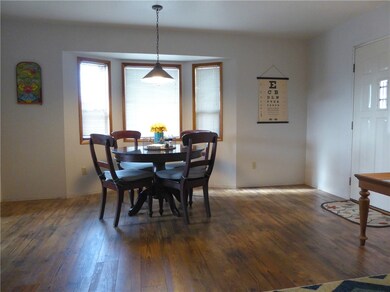
Attention Investors! Great opportunity to buy turn-key 4-plex in heart of Lynden. Over 10,000 sqft corner lot with alley access, landscaped, includes 4-car carport for each unit & 3 additional parking spaces (not including the curb surrounding property & fronting Front Street). All one story, units are all 2 bedroom/1bath, all appliances included, natural gas furnace & water heaters (with separate metered utilities). Great occupancy history, this investment property won't last!
Last Agent to Sell the Property
RE/MAX Whatcom County, Inc. License #24674 Listed on: 04/06/2015
Last Buyer's Agent
Linda Zemler
RE/MAX Whatcom County, Inc. License #100605
Source: Northwest Multiple Listing Service (NWMLS)
MLS#: 766907
| Date | Buyer | Sale Price | Title Company |
|---|---|---|---|
| Salish Estates Llc | $313 | Accommodation/Courtesy Recordi | |
| Salish Estates Llc | -- | Accommodation | |
| Bouma Robert | $475,000 | Chicago Title Insurance |
| Date | Status | Borrower | Loan Amount |
|---|---|---|---|
| Previous Owner | Bouma Robert | $260,000 |
| Date | Event | Price | List to Sale | Price per Sq Ft |
|---|---|---|---|---|
| 12/07/2015 12/07/15 | Sold | $475,000 | -13.6% | $134 / Sq Ft |
| 11/01/2015 11/01/15 | Pending | -- | -- | -- |
| 04/06/2015 04/06/15 | For Sale | $549,900 | -- | $156 / Sq Ft |
| Year | Tax Paid | Tax Assessment Tax Assessment Total Assessment is a certain percentage of the fair market value that is determined by local assessors to be the total taxable value of land and additions on the property. | Land | Improvement |
|---|---|---|---|---|
| 2024 | $5,287 | $747,541 | $242,500 | $505,041 |
| 2023 | $5,287 | $735,616 | $250,000 | $485,616 |
| 2022 | $5,579 | $732,152 | $216,612 | $515,540 |
| 2021 | $5,472 | $605,077 | $179,016 | $426,061 |
| 2020 | $4,794 | $540,262 | $159,840 | $380,422 |
| 2019 | $4,265 | $495,480 | $146,760 | $348,720 |
| 2018 | $4,661 | $451,881 | $133,692 | $318,189 |
| 2017 | $4,086 | $405,602 | $120,000 | $285,602 |
| 2016 | $3,858 | $378,122 | $118,800 | $259,322 |
| 2015 | $3,420 | $355,088 | $114,264 | $240,824 |
| 2014 | -- | $343,056 | $110,376 | $232,680 |
| 2013 | -- | $340,680 | $108,000 | $232,680 |
Seller's Agent in 2015
Danielle Groeneweg
RE/MAX
(360) 483-6490
51 in this area
112 Total Sales
L
Buyer's Agent in 2015
Linda Zemler
RE/MAX Whatcom County
Source: Northwest Multiple Listing Service (NWMLS)
MLS Number: 766907
APN: 400320-149211-0000
Disclaimer: Certain information contained herein is derived from information provided by parties other than Homes.com. All information provided is deemed reliable, but is not guaranteed to be accurate and should be independently verified.
![]() All data is obtained from various sources and may not have been verified by broker or MLS GRID. Supplied Open House Information is subject to change without notice. All information should be independently reviewed and verified for accuracy. Properties may or may not be listed by the office/agent presenting the information. Listing information is provided by the Northwest Multiple Listing Service (NWMLS). Property information is based on available data that may include MLS information, county records, and other sources. Listings marked with the 3 tree icon and provided by NWMLS. All properties are subject to prior sale or withdrawal. IDX information is provided exclusively for consumers’ personal noncommercial use, that it may not be used for any purpose other than to identify prospective properties consumers may be interested in purchasing, that the data is deemed reliable but is not guaranteed by MLS GRID. ©2025 NWMLS.
All data is obtained from various sources and may not have been verified by broker or MLS GRID. Supplied Open House Information is subject to change without notice. All information should be independently reviewed and verified for accuracy. Properties may or may not be listed by the office/agent presenting the information. Listing information is provided by the Northwest Multiple Listing Service (NWMLS). Property information is based on available data that may include MLS information, county records, and other sources. Listings marked with the 3 tree icon and provided by NWMLS. All properties are subject to prior sale or withdrawal. IDX information is provided exclusively for consumers’ personal noncommercial use, that it may not be used for any purpose other than to identify prospective properties consumers may be interested in purchasing, that the data is deemed reliable but is not guaranteed by MLS GRID. ©2025 NWMLS.
Based on information submitted to the MLS GRID