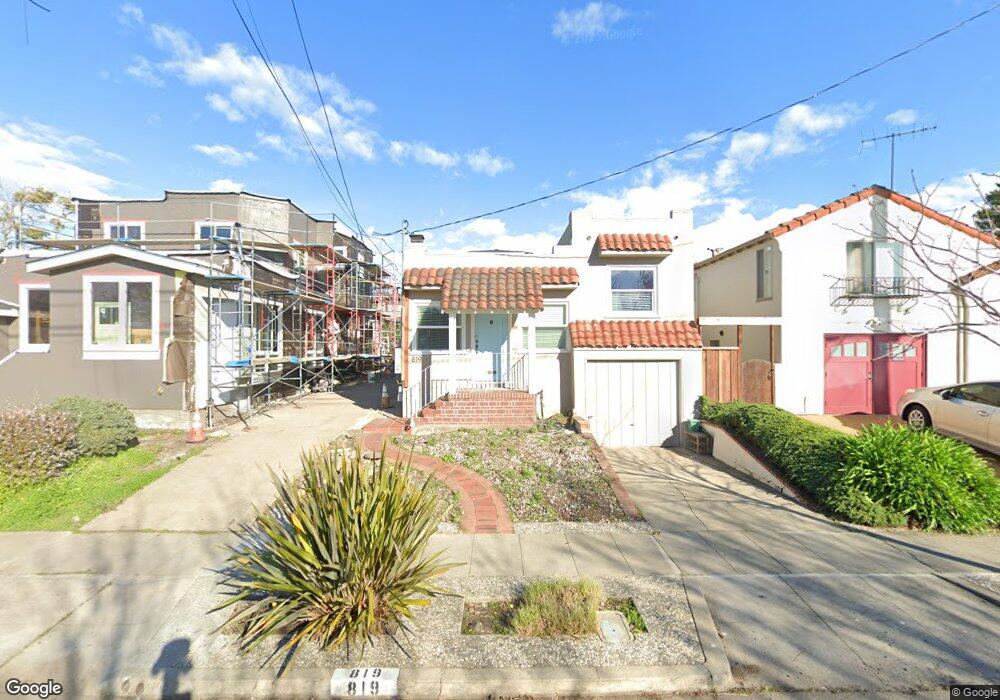
819 Key Route Blvd Albany, CA 94706
Thousand Oaks NeighborhoodEstimated Value: $1,105,000 - $1,184,000
3
Beds
1
Bath
1,084
Sq Ft
$1,054/Sq Ft
Est. Value
About This Home
This home is located at 819 Key Route Blvd, Albany, CA 94706 and is currently estimated at $1,142,144, approximately $1,053 per square foot. 819 Key Route Blvd is a home located in Alameda County with nearby schools including Albany Middle School, Albany High School, and Tehiyah Day School.
Ownership History
Date
Name
Owned For
Owner Type
Purchase Details
Closed on
Sep 20, 2021
Sold by
Magness Scott and Noone Tara
Bought by
Magness Scott and Noone Tara
Current Estimated Value
Purchase Details
Closed on
Sep 6, 2007
Sold by
Yu Bin and Shen Ke Ning
Bought by
Magness Scott and Noone Tara
Home Financials for this Owner
Home Financials are based on the most recent Mortgage that was taken out on this home.
Original Mortgage
$417,000
Outstanding Balance
$265,366
Interest Rate
6.67%
Mortgage Type
Purchase Money Mortgage
Estimated Equity
$876,778
Purchase Details
Closed on
May 13, 2002
Sold by
Harper Agnes E and Stritzinger Family Trust
Bought by
Shen Ke Ning and Yu Bin
Home Financials for this Owner
Home Financials are based on the most recent Mortgage that was taken out on this home.
Original Mortgage
$100,000
Interest Rate
7.13%
Purchase Details
Closed on
Apr 9, 1996
Sold by
Stritzinger Earl C and Stritzinger Margaret L
Bought by
Stritzinger Earl C and Stritzinger Margaret L
Create a Home Valuation Report for This Property
The Home Valuation Report is an in-depth analysis detailing your home's value as well as a comparison with similar homes in the area
Home Values in the Area
Average Home Value in this Area
Purchase History
| Date | Buyer | Sale Price | Title Company |
|---|---|---|---|
| Magness Scott | -- | None Available | |
| Magness Scott | $554,000 | Chicago Title Co | |
| Shen Ke Ning | $430,000 | Old Republic Title Company | |
| Stritzinger Earl C | -- | -- |
Source: Public Records
Mortgage History
| Date | Status | Borrower | Loan Amount |
|---|---|---|---|
| Open | Magness Scott | $417,000 | |
| Previous Owner | Shen Ke Ning | $100,000 |
Source: Public Records
Tax History
| Year | Tax Paid | Tax Assessment Tax Assessment Total Assessment is a certain percentage of the fair market value that is determined by local assessors to be the total taxable value of land and additions on the property. | Land | Improvement |
|---|---|---|---|---|
| 2025 | $12,635 | $720,640 | $218,292 | $509,348 |
| 2024 | $12,635 | $706,374 | $214,012 | $499,362 |
| 2023 | $12,352 | $699,391 | $209,817 | $489,574 |
| 2022 | $11,912 | $678,680 | $205,704 | $479,976 |
| 2021 | $11,745 | $665,240 | $201,672 | $470,568 |
| 2020 | $11,604 | $665,347 | $199,604 | $465,743 |
| 2019 | $11,346 | $652,307 | $195,692 | $456,615 |
| 2018 | $11,028 | $639,520 | $191,856 | $447,664 |
| 2017 | $10,754 | $626,983 | $188,095 | $438,888 |
| 2016 | $10,242 | $614,690 | $184,407 | $430,283 |
| 2015 | $9,566 | $605,460 | $181,638 | $423,822 |
| 2014 | $9,298 | $580,000 | $174,000 | $406,000 |
Source: Public Records
Map
Nearby Homes
- 840 Key Route Blvd
- 816 Talbot Ave
- 922 Carmel Ave
- 848 Stannage Ave Unit 11
- 858 Neilson St
- 946 Kains Ave
- 1339 Thousand Oaks Blvd
- 1034 Evelyn Ave
- 986 Kains Ave
- 1036 Ramona Ave
- 605 San Pablo Ave
- 517 Stannage Ave
- 1037 Stannage Ave
- 1059 Talbot Ave
- 1231 Brighton Ave
- 417 Evelyn Ave Unit 205
- 417 Evelyn Ave Unit 302
- 130 Behrens St
- 955 Jackson St
- 949 Ordway St
- 817 Key Route Blvd
- 823 Key Route Blvd
- 813 Key Route Blvd
- 825 Key Route Blvd
- 822 Pomona Ave
- 824 Pomona Ave
- 820 Pomona Ave
- 811 Key Route Blvd
- 827 Key Route Blvd
- 826 Pomona Ave
- 818 Pomona Ave
- 809 Key Route Blvd
- 829 Key Route Blvd
- 828 Pomona Ave
- 816 Pomona Ave
- 807 Key Route Blvd
- 830 Pomona Ave
- 833 Key Route Blvd
- 808 Pomona Ave
- 805 Key Route Blvd
Your Personal Tour Guide
Ask me questions while you tour the home.