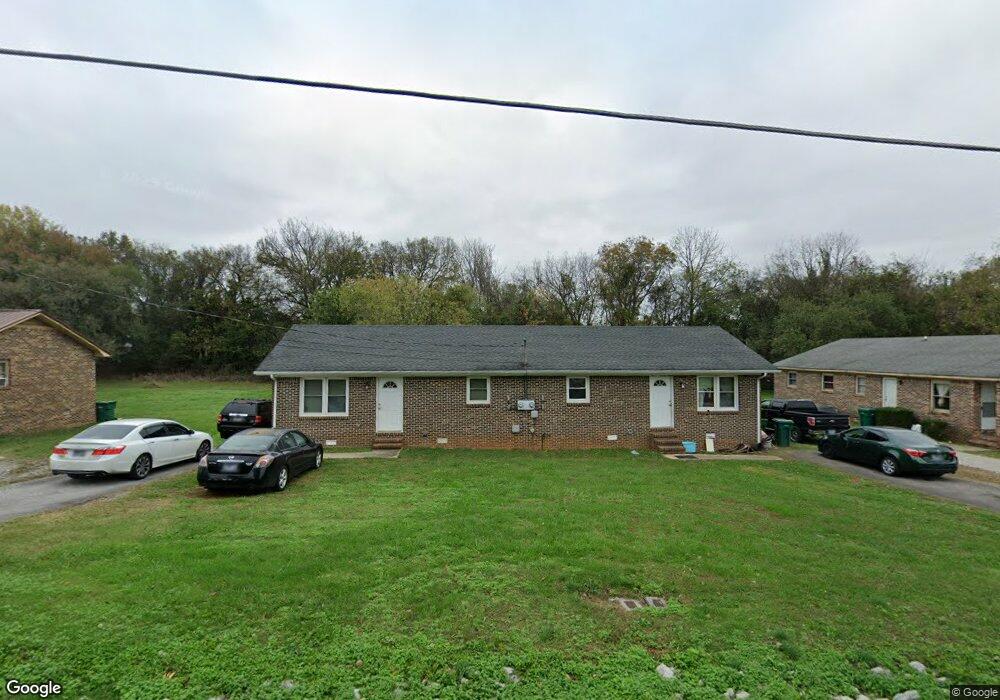
819 Mason Ave Winchester, TN 37398
Estimated Value: $164,000 - $255,000
--
Bed
2
Baths
1,612
Sq Ft
$122/Sq Ft
Est. Value
About This Home
This home is located at 819 Mason Ave, Winchester, TN 37398 and is currently estimated at $196,592, approximately $121 per square foot. 819 Mason Ave is a home located in Franklin County with nearby schools including North Middle School, Franklin County High School, and School of the Good Shepherd.
Ownership History
Date
Name
Owned For
Owner Type
Purchase Details
Closed on
Mar 13, 2020
Sold by
Slingshot Properties
Bought by
Clark Thomas L and Stewart Holly L
Current Estimated Value
Home Financials for this Owner
Home Financials are based on the most recent Mortgage that was taken out on this home.
Original Mortgage
$68,491
Outstanding Balance
$47,428
Interest Rate
3.5%
Mortgage Type
Commercial
Estimated Equity
$149,164
Purchase Details
Closed on
Nov 2, 2015
Sold by
Couch John Wesley
Bought by
Slingshot Properties
Purchase Details
Closed on
Feb 21, 2006
Sold by
Henderson James E Tr
Bought by
Couch John Wesley
Purchase Details
Closed on
Feb 28, 1991
Bought by
Henderson Estelle N Etvir J E Hende
Purchase Details
Closed on
Feb 15, 1991
Bought by
Russell John D and Russell Edith M
Purchase Details
Closed on
Feb 4, 1991
Bought by
Dominion Bank Of Middle Tn
Create a Home Valuation Report for This Property
The Home Valuation Report is an in-depth analysis detailing your home's value as well as a comparison with similar homes in the area
Home Values in the Area
Average Home Value in this Area
Purchase History
| Date | Buyer | Sale Price | Title Company |
|---|---|---|---|
| Clark Thomas L | $82,000 | Access Title & Escrow Inc | |
| Slingshot Properties | -- | -- | |
| Couch John Wesley | $55,000 | -- | |
| Henderson Estelle N Etvir J E Hende | $39,000 | -- | |
| Russell John D | $39,000 | -- | |
| Dominion Bank Of Middle Tn | $39,000 | -- |
Source: Public Records
Mortgage History
| Date | Status | Borrower | Loan Amount |
|---|---|---|---|
| Open | Clark Thomas L | $68,491 |
Source: Public Records
Tax History Compared to Growth
Tax History
| Year | Tax Paid | Tax Assessment Tax Assessment Total Assessment is a certain percentage of the fair market value that is determined by local assessors to be the total taxable value of land and additions on the property. | Land | Improvement |
|---|---|---|---|---|
| 2024 | $1,315 | $51,120 | $5,840 | $45,280 |
| 2023 | $1,315 | $51,120 | $5,840 | $45,280 |
| 2022 | $1,289 | $51,120 | $5,840 | $45,280 |
| 2021 | $755 | $51,120 | $5,840 | $45,280 |
| 2020 | $1,042 | $29,480 | $4,320 | $25,160 |
| 2019 | $1,042 | $29,480 | $4,320 | $25,160 |
| 2018 | $982 | $29,480 | $4,320 | $25,160 |
| 2017 | $982 | $29,480 | $4,320 | $25,160 |
| 2016 | $869 | $26,080 | $4,000 | $22,080 |
| 2015 | $852 | $26,080 | $4,000 | $22,080 |
| 2014 | $853 | $26,098 | $0 | $0 |
Source: Public Records
Map
Nearby Homes
- 114 Allen Dr
- 108 Allen Dr
- 209 Franklin Park
- 120 Dogwood Ln
- 132 Highland Dr
- 136 Bel Aire Dr
- 105 Lakeview Dr
- 118 Noles St
- 713 Hunt St
- 505 Kindel Dr
- 709 Hunt St
- 105 Edgewater Dr
- 0 Old Cowan Rd Unit RTC2970796
- 103 Lisa Cir
- 0 Mary Sharp Dr
- 0 Sharp Springs Rd Unit RTC2980057
- 307 Mary Sharp Dr
- 0 Spring Hill Dr
- 1019 Old Cowan Rd
- 208 Tammy Dr