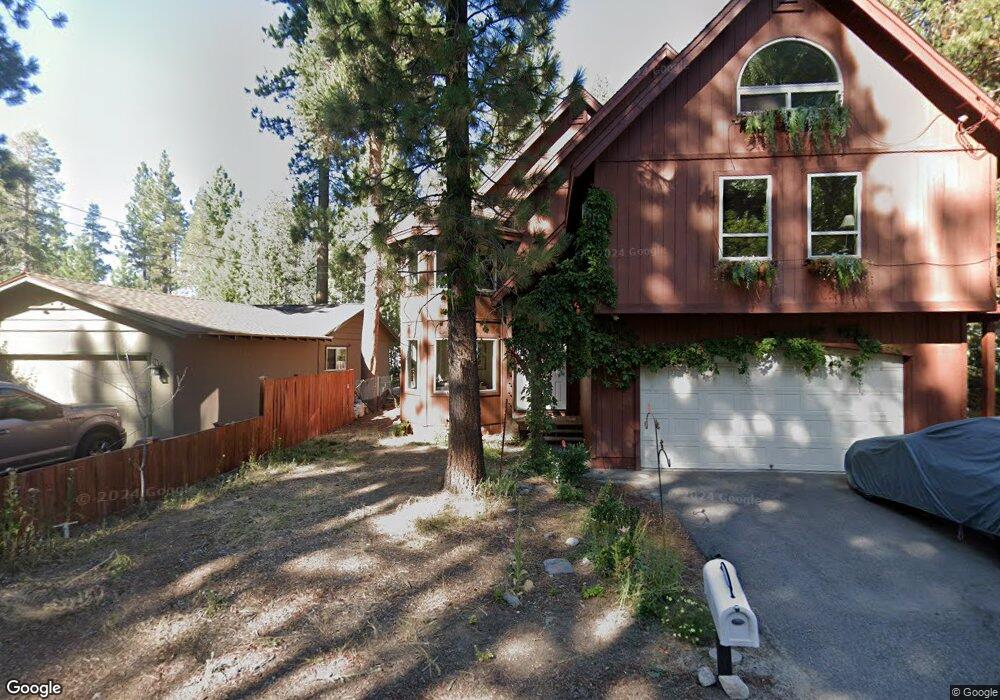
819 Michael Dr South Lake Tahoe, CA 96150
Estimated Value: $632,984 - $741,000
3
Beds
2
Baths
1,348
Sq Ft
$504/Sq Ft
Est. Value
About This Home
This home is located at 819 Michael Dr, South Lake Tahoe, CA 96150 and is currently estimated at $679,746, approximately $504 per square foot. 819 Michael Dr is a home located in El Dorado County with nearby schools including Tahoe Valley Elementary School, South Tahoe Middle School, and South Tahoe High School.
Ownership History
Date
Name
Owned For
Owner Type
Purchase Details
Closed on
Jul 2, 2024
Sold by
Lucia Michael P and Lucia Cheryl A
Bought by
Lucia Family Trust and Lucia
Current Estimated Value
Purchase Details
Closed on
May 30, 2000
Sold by
Lam Ken W
Bought by
Lucia Michael P and Lucia Cheryl A
Home Financials for this Owner
Home Financials are based on the most recent Mortgage that was taken out on this home.
Original Mortgage
$184,950
Interest Rate
4.95%
Purchase Details
Closed on
Apr 1, 1999
Sold by
Rosecrance Marion F Tr and Rosecrance Rev Tr Of 6/30/92 Etal
Bought by
Lam Ken W
Home Financials for this Owner
Home Financials are based on the most recent Mortgage that was taken out on this home.
Original Mortgage
$122,000
Interest Rate
6.75%
Purchase Details
Closed on
Apr 26, 1996
Sold by
Rosecrance John Dana and Rosecrance Marion F
Bought by
Rosecrance Marion F and The Rosecrance Family Living T
Create a Home Valuation Report for This Property
The Home Valuation Report is an in-depth analysis detailing your home's value as well as a comparison with similar homes in the area
Home Values in the Area
Average Home Value in this Area
Purchase History
| Date | Buyer | Sale Price | Title Company |
|---|---|---|---|
| Lucia Family Trust | -- | None Listed On Document | |
| Lucia Michael P | $205,500 | Fidelity National Title Co | |
| Lam Ken W | $167,000 | Inter County Title Co | |
| Rosecrance Marion F | -- | -- |
Source: Public Records
Mortgage History
| Date | Status | Borrower | Loan Amount |
|---|---|---|---|
| Previous Owner | Lucia Michael P | $184,950 | |
| Previous Owner | Lam Ken W | $122,000 |
Source: Public Records
Tax History Compared to Growth
Tax History
| Year | Tax Paid | Tax Assessment Tax Assessment Total Assessment is a certain percentage of the fair market value that is determined by local assessors to be the total taxable value of land and additions on the property. | Land | Improvement |
|---|---|---|---|---|
| 2025 | $3,376 | $315,817 | $61,463 | $254,354 |
| 2024 | $3,376 | $309,625 | $60,258 | $249,367 |
| 2023 | $3,317 | $303,555 | $59,077 | $244,478 |
| 2022 | $3,285 | $297,604 | $57,919 | $239,685 |
| 2021 | $3,234 | $291,770 | $56,784 | $234,986 |
| 2020 | $3,188 | $288,779 | $56,202 | $232,577 |
| 2019 | $3,173 | $283,117 | $55,100 | $228,017 |
| 2018 | $3,102 | $277,567 | $54,020 | $223,547 |
| 2017 | $3,054 | $272,125 | $52,961 | $219,164 |
| 2016 | $2,992 | $266,790 | $51,923 | $214,867 |
| 2015 | $2,841 | $262,785 | $51,144 | $211,641 |
| 2014 | $2,841 | $257,641 | $50,144 | $207,497 |
Source: Public Records
Map
Nearby Homes
- 803 Michael Dr
- 783 Michael Ct Unit Share B
- 783 Michael Ct
- 2337 Sky Meadows Ct
- 2244 Texas Ave
- 2293 Eloise Ave Unit D
- 914 Tahoe Island Dr
- 1025 Winnemucca Ave
- 1040 Truckee Dr
- 555 Tahoe Keys Blvd Unit 13
- 2948 Pinewood Dr
- 497 Tahoe Keys Blvd Unit 20
- 2191 Butler Ave
- 941 Silver Dollar Ave
- 2484 Palmira Ave
- 2185 Morro Dr
- 489 Tahoe Keys Blvd Unit 55
- 489 Tahoe Keys Blvd Unit 47
- 489 Tahoe Keys Blvd Unit 68
- 489 Tahoe Keys Blvd Unit 56
- 823 Michael Dr
- 813 Michael Dr
- 827 Michael Dr
- 807 Michael Dr
- 820 Michael Dr
- 810 Michael Dr
- 2327 Idaho Ave
- 2316 Wyoming Ave
- 841 Michael Dr
- 2319 Wyoming Ave
- 2318 Montana Ave
- 2323 Idaho Ave
- 2314 Montana Ave
- 845 Michael Dr
- 791 Michael Dr
- 840 Michael Dr
- 2308 Montana Ave
- 2309 Wyoming Ave
- 2326 Idaho Ave
- 849 Michael Dr