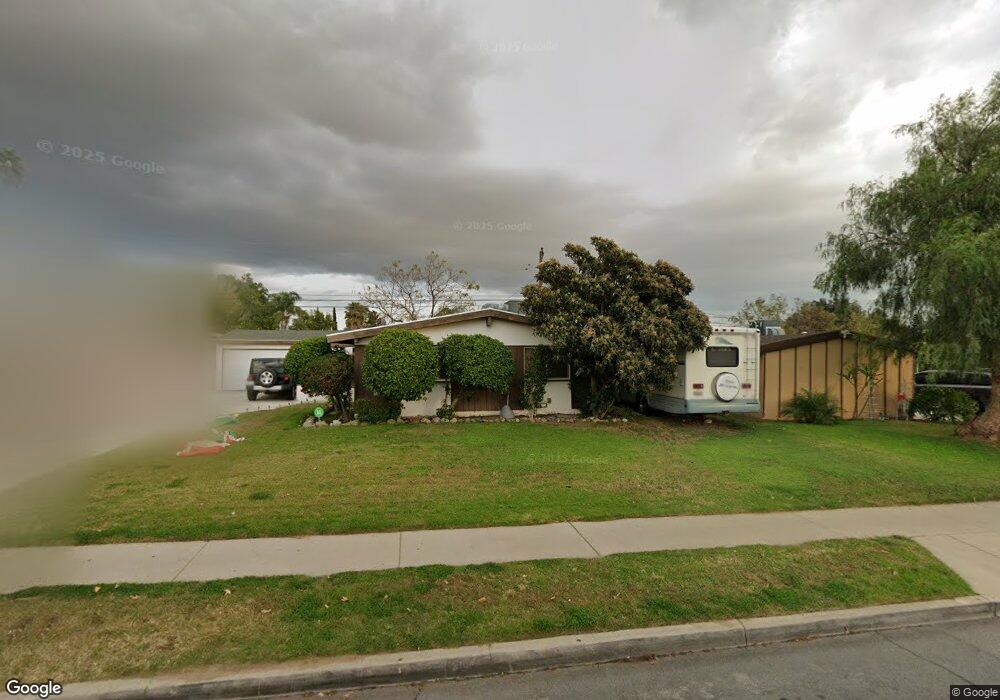
819 N Lilac Ave Rialto, CA 92376
Estimated Value: $519,000 - $585,000
3
Beds
2
Baths
1,478
Sq Ft
$372/Sq Ft
Est. Value
About This Home
This home is located at 819 N Lilac Ave, Rialto, CA 92376 and is currently estimated at $549,117, approximately $371 per square foot. 819 N Lilac Ave is a home located in San Bernardino County with nearby schools including Dunn Elementary School, Ethel Kucera Middle School, and Eisenhower High School.
Ownership History
Date
Name
Owned For
Owner Type
Purchase Details
Closed on
May 14, 2016
Sold by
Weaver Noah Justin
Bought by
Weaver Joshua Wiley
Current Estimated Value
Purchase Details
Closed on
Feb 14, 2011
Sold by
Cdcb Holdings Llc
Bought by
Weaver Noah Justin
Home Financials for this Owner
Home Financials are based on the most recent Mortgage that was taken out on this home.
Original Mortgage
$143,829
Interest Rate
4.87%
Mortgage Type
FHA
Purchase Details
Closed on
Aug 25, 2010
Sold by
Thompson Ben and Thompson Ruby
Bought by
Cdcb Holdings Llc
Purchase Details
Closed on
Feb 12, 2004
Sold by
Weaver Darlene E
Bought by
Thompson Ben and Thompson Ruby
Purchase Details
Closed on
Mar 5, 2003
Sold by
Weaver Darlene E
Bought by
Weaver Darlene E and Thompson Ben
Home Financials for this Owner
Home Financials are based on the most recent Mortgage that was taken out on this home.
Original Mortgage
$75,000
Interest Rate
5.83%
Create a Home Valuation Report for This Property
The Home Valuation Report is an in-depth analysis detailing your home's value as well as a comparison with similar homes in the area
Home Values in the Area
Average Home Value in this Area
Purchase History
| Date | Buyer | Sale Price | Title Company |
|---|---|---|---|
| Weaver Joshua Wiley | -- | None Available | |
| Weaver Noah Justin | $150,000 | First American Title Company | |
| Cdcb Holdings Llc | $100,000 | First American Title Company | |
| Thompson Ben | -- | -- | |
| Weaver Darlene E | -- | Southland Title Corporation | |
| Weaver Darlene E | -- | Southland Title Corporation |
Source: Public Records
Mortgage History
| Date | Status | Borrower | Loan Amount |
|---|---|---|---|
| Previous Owner | Weaver Noah Justin | $143,829 | |
| Previous Owner | Weaver Darlene E | $75,000 |
Source: Public Records
Tax History Compared to Growth
Tax History
| Year | Tax Paid | Tax Assessment Tax Assessment Total Assessment is a certain percentage of the fair market value that is determined by local assessors to be the total taxable value of land and additions on the property. | Land | Improvement |
|---|---|---|---|---|
| 2025 | $4,303 | $324,965 | $81,242 | $243,723 |
| 2024 | $4,303 | $318,593 | $79,649 | $238,944 |
| 2023 | $4,564 | $312,346 | $78,087 | $234,259 |
| 2022 | $4,229 | $306,222 | $76,556 | $229,666 |
| 2021 | $4,204 | $300,218 | $75,055 | $225,163 |
| 2020 | $4,219 | $297,139 | $74,285 | $222,854 |
| 2019 | $4,130 | $291,312 | $72,828 | $218,484 |
| 2018 | $4,279 | $285,600 | $71,400 | $214,200 |
| 2017 | $2,408 | $165,476 | $38,637 | $126,839 |
| 2016 | $2,045 | $162,231 | $37,879 | $124,352 |
| 2015 | $2,052 | $159,794 | $37,310 | $122,484 |
| 2014 | $1,928 | $156,664 | $36,579 | $120,085 |
Source: Public Records
Map
Nearby Homes
- 836 N Millard Ave
- 885 N Millard Ave
- 1031 N Lilac Ave
- 1018 N Millard Ave
- 249 W Morgan St
- 590 N Lilac Ave
- 215 W Valencia St
- 955 W Jasmine Way
- 847 N Idyllwild Ave
- 1005 N Alice Ave
- 264 W Jackson St
- 242 W Jackson St
- 459 W Ramona Dr
- 786 N Arrowhead Ave
- 531 W Ramona Dr
- 935 W Wabash St
- 350 N Clifford Ave
- 342 N Clifford Ave
- 153 E Jackson St
- 1029 W Madrona St
- 825 N Lilac Ave
- 813 N Lilac Ave
- 818 N Verde Ave
- 824 N Verde Ave
- 812 N Verde Ave
- 833 N Lilac Ave
- 807 N Lilac Ave
- 832 N Verde Ave
- 806 N Verde Ave
- 839 N Lilac Ave
- 801 N Lilac Ave
- 838 N Verde Ave
- 800 N Verde Ave
- 819 N Verde Ave
- 825 N Verde Ave
- 813 N Verde Ave
- 845 N Lilac Ave
- 844 N Verde Ave
- 833 N Verde Ave
- 807 N Verde Ave