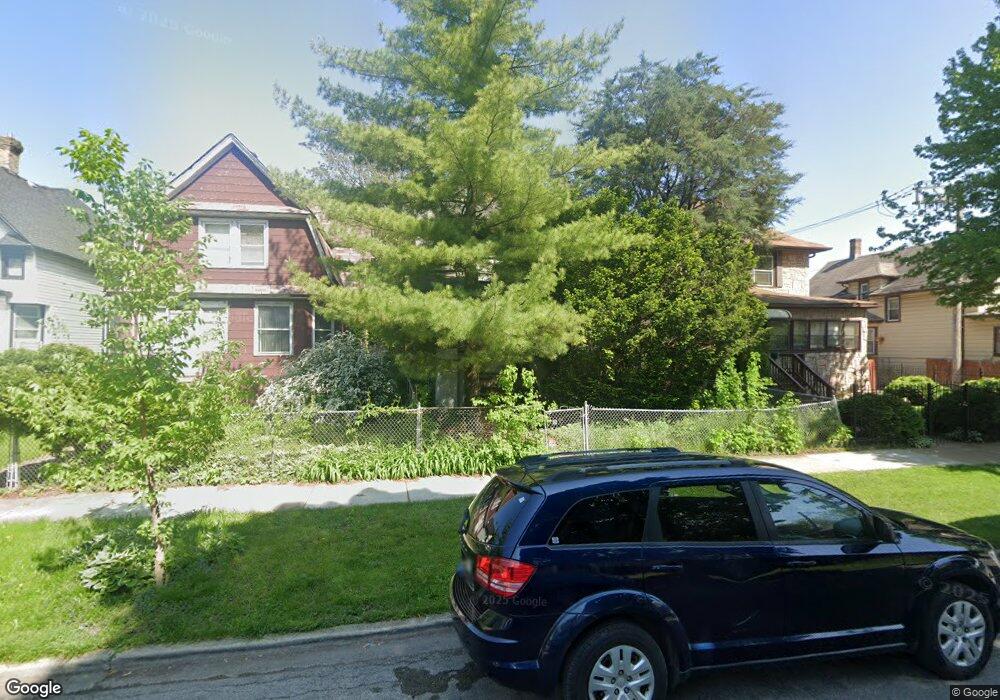
819 N Lorel Ave Chicago, IL 60651
Austin NeighborhoodEstimated Value: $191,000 - $315,000
3
Beds
2
Baths
1,620
Sq Ft
$165/Sq Ft
Est. Value
About This Home
This home is located at 819 N Lorel Ave, Chicago, IL 60651 and is currently estimated at $267,550, approximately $165 per square foot. 819 N Lorel Ave is a home located in Cook County with nearby schools including Howe School of Excellence, Orr Academy High School, and Moving Everest Charter School.
Ownership History
Date
Name
Owned For
Owner Type
Purchase Details
Closed on
May 2, 2014
Sold by
Bulinski Betty Jane
Bought by
Bulinski Ruth
Current Estimated Value
Purchase Details
Closed on
Nov 14, 1996
Sold by
Bulinski Betty
Bought by
Bulinski Betty and Bulinski Ruth
Create a Home Valuation Report for This Property
The Home Valuation Report is an in-depth analysis detailing your home's value as well as a comparison with similar homes in the area
Home Values in the Area
Average Home Value in this Area
Purchase History
| Date | Buyer | Sale Price | Title Company |
|---|---|---|---|
| Bulinski Ruth | -- | None Available | |
| Bulinski Betty | -- | -- |
Source: Public Records
Tax History Compared to Growth
Tax History
| Year | Tax Paid | Tax Assessment Tax Assessment Total Assessment is a certain percentage of the fair market value that is determined by local assessors to be the total taxable value of land and additions on the property. | Land | Improvement |
|---|---|---|---|---|
| 2024 | $1,808 | $19,700 | $5,467 | $14,233 |
| 2023 | $1,724 | $14,539 | $4,328 | $10,211 |
| 2022 | $1,724 | $14,539 | $4,328 | $10,211 |
| 2021 | $2,254 | $14,538 | $4,328 | $10,210 |
| 2020 | $2,701 | $15,225 | $3,872 | $11,353 |
| 2019 | $2,710 | $16,917 | $3,872 | $13,045 |
| 2018 | $2,663 | $16,917 | $3,872 | $13,045 |
| 2017 | $2,173 | $13,470 | $3,417 | $10,053 |
| 2016 | $2,198 | $13,470 | $3,417 | $10,053 |
| 2015 | $1,988 | $13,470 | $3,417 | $10,053 |
| 2014 | $1,892 | $12,766 | $3,189 | $9,577 |
| 2013 | $1,844 | $12,766 | $3,189 | $9,577 |
Source: Public Records
Map
Nearby Homes
- 822 N Lockwood Ave
- 855 N Lockwood Ave
- 5256 W Chicago Ave
- 844 N Laramie Ave
- 5415 W Augusta Blvd
- 744 N Long Ave
- 701 N Lorel Ave
- 1059 N Lorel Ave
- 1000 N Leamington Ave
- 5508 W Chicago Ave
- 645 N Long Ave
- 5440 W Cortez St
- 912 N Leclaire Ave
- 655 N Lotus Ave
- 940 N Leclaire Ave
- 737 N Leamington Ave
- 5412 W Thomas St
- 5320 W Ohio St
- 5516 W Cortez St
- 604 N Latrobe Ave
- 823 N Lorel Ave
- 817 N Lorel Ave
- 827 N Lorel Ave
- 811 N Lorel Ave
- 829 N Lorel Ave
- 807 N Lorel Ave
- 833 N Lorel Ave
- 816 N Lockwood Ave
- 816 N Lockwood Ave
- 826 N Lockwood Ave
- 837 N Lorel Ave
- 803 N Lorel Ave
- 820 N Lockwood Ave
- 822 N Lockwood Ave
- 832 N Lockwood Ave
- 818 N Lorel Ave
- 822 N Lorel Ave
- 814 N Lorel Ave
- 5310 W Chicago Ave
- 839 N Lorel Ave