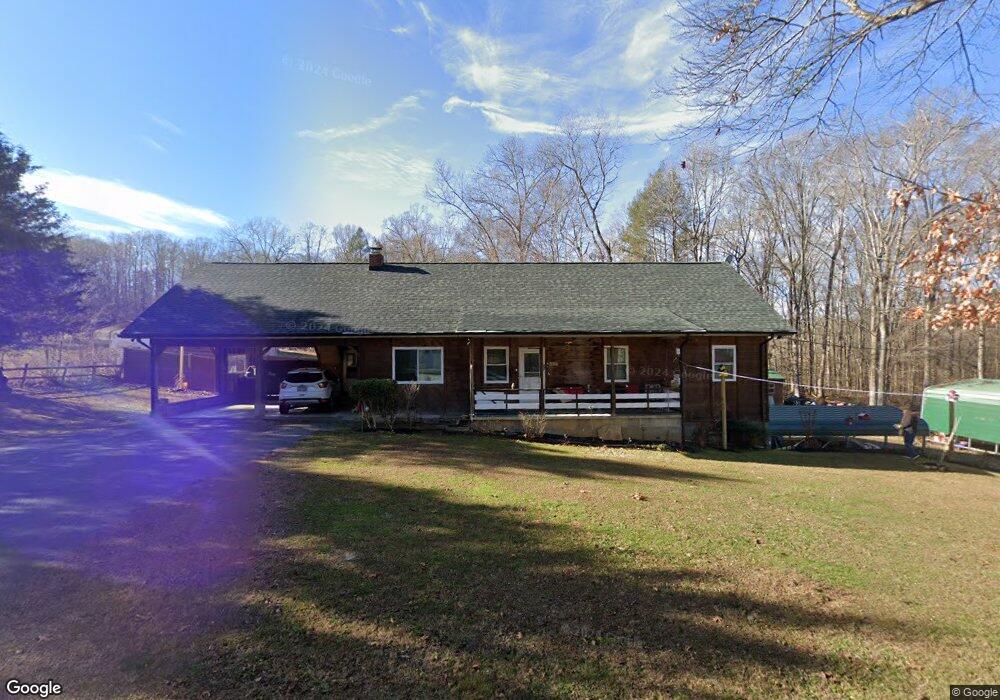
819 Reagan Cir Seymour, TN 37865
Estimated Value: $363,000 - $372,064
--
Bed
3
Baths
1,344
Sq Ft
$273/Sq Ft
Est. Value
About This Home
This home is located at 819 Reagan Cir, Seymour, TN 37865 and is currently estimated at $367,532, approximately $273 per square foot. 819 Reagan Cir is a home located in Sevier County with nearby schools including Northview Elementary School, Catons Chapel Elementary School, and Jones Cove Elementary School.
Ownership History
Date
Name
Owned For
Owner Type
Purchase Details
Closed on
Jan 21, 2008
Sold by
Martin Sepeda
Bought by
Martin Sepeda
Current Estimated Value
Purchase Details
Closed on
Oct 25, 2005
Sold by
Citifinancial Mortgage Com
Bought by
Martin Sepeda
Home Financials for this Owner
Home Financials are based on the most recent Mortgage that was taken out on this home.
Original Mortgage
$113,900
Interest Rate
6.83%
Purchase Details
Closed on
Jul 19, 2005
Bought by
Citi Financial Mortgage Company Inc Ste 100
Purchase Details
Closed on
Feb 21, 2002
Sold by
Mellon William R
Bought by
Ferguson Melvin W
Home Financials for this Owner
Home Financials are based on the most recent Mortgage that was taken out on this home.
Original Mortgage
$125,000
Interest Rate
7.64%
Purchase Details
Closed on
Apr 24, 1997
Sold by
Lyn Latham David
Bought by
William Mellon
Create a Home Valuation Report for This Property
The Home Valuation Report is an in-depth analysis detailing your home's value as well as a comparison with similar homes in the area
Home Values in the Area
Average Home Value in this Area
Purchase History
| Date | Buyer | Sale Price | Title Company |
|---|---|---|---|
| Martin Sepeda | -- | -- | |
| Martin Sepeda | $142,400 | -- | |
| Citi Financial Mortgage Company Inc Ste 100 | $118,500 | -- | |
| Ferguson Melvin W | $125,000 | -- | |
| William Mellon | $15,000 | -- |
Source: Public Records
Mortgage History
| Date | Status | Borrower | Loan Amount |
|---|---|---|---|
| Previous Owner | William Mellon | $113,900 | |
| Previous Owner | William Mellon | $125,000 |
Source: Public Records
Tax History Compared to Growth
Tax History
| Year | Tax Paid | Tax Assessment Tax Assessment Total Assessment is a certain percentage of the fair market value that is determined by local assessors to be the total taxable value of land and additions on the property. | Land | Improvement |
|---|---|---|---|---|
| 2025 | $767 | $51,850 | $3,325 | $48,525 |
| 2024 | $767 | $51,850 | $3,325 | $48,525 |
| 2023 | $767 | $51,850 | $0 | $0 |
| 2022 | $767 | $51,850 | $3,325 | $48,525 |
| 2021 | $767 | $51,850 | $3,325 | $48,525 |
| 2020 | $741 | $51,850 | $3,325 | $48,525 |
| 2019 | $741 | $39,825 | $2,950 | $36,875 |
| 2018 | $741 | $39,825 | $2,950 | $36,875 |
| 2017 | $741 | $39,825 | $2,950 | $36,875 |
| 2016 | $741 | $39,825 | $2,950 | $36,875 |
| 2015 | -- | $43,550 | $0 | $0 |
| 2014 | $710 | $43,558 | $0 | $0 |
Source: Public Records
Map
Nearby Homes
- 0 Sauls Rd
- 1936 Dripping Springs Rd
- 926 Sauls Rd
- 1566 Hawk Ln
- 1582 Hawk Ln
- 1419 S Delozier Rd
- 1053 Reagan Springs Rd
- 1108 Stanton Rd
- 0 Reagan Springs Rd Unit 307121
- 0 Reagan Springs Rd Unit 1306115
- 1036 Stanton Rd
- 1477 Old Chilhowee Rd
- 1478 Old Chilhowee Rd
- 0 Dupont Rd Unit 704435
- 0 Dupont Rd Unit 302113
- 0 Dupont Rd Unit 1269924
- 1868 S Delozier Rd
- 813 Wye Dr
- 1015 Ruff Grouse Way
- 0 Wye Dr
- 809 Reagan Cir
- 827 Reagan Cir
- 0 Reagan Ln
- 822 Reagan Cir
- 801 Reagan Cir
- 816 Reagan Cir
- 828 Reagan Cir
- 1935 Latham Ln
- 1926 Latham Ln
- 802 Reagan Cir
- 1920 Latham Ln
- 1919 Latham Ln
- 1925 Latham Ln
- 1917 Latham Ln
- 1933 Dripping Springs Rd
- 1929 Jerry Lynn Way
- 1887 Dripping Springs Rd
- 919 W Lewelling Rd
- 1968 Dripping Springs Rd
- 1925 Jerry Lynn Way