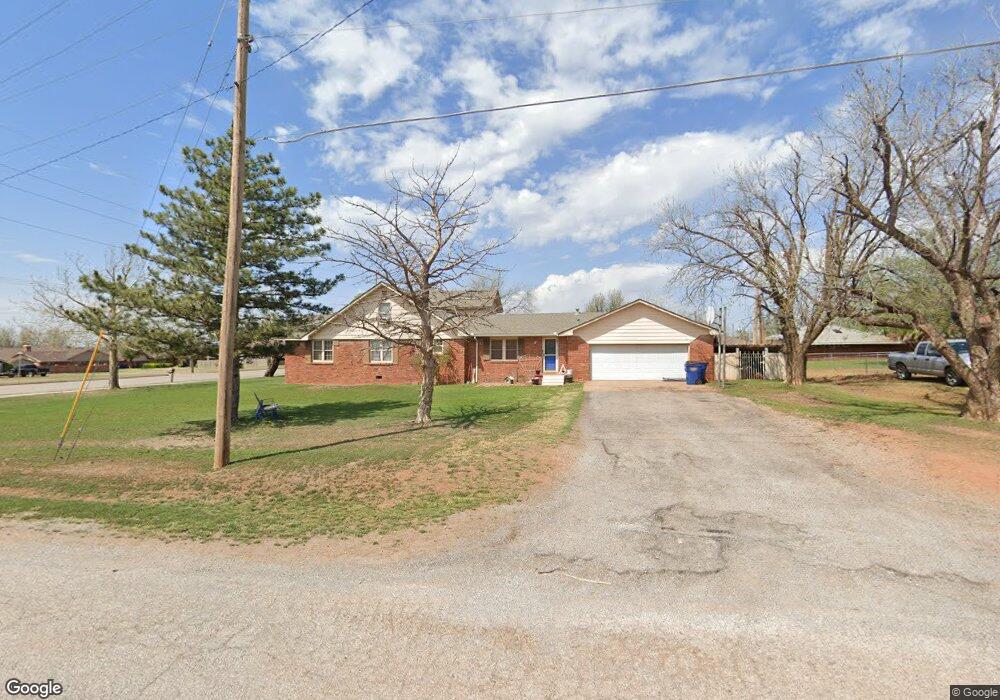
819 S 13th St Kingfisher, OK 73750
Estimated Value: $256,000 - $295,000
5
Beds
2
Baths
2,140
Sq Ft
$128/Sq Ft
Est. Value
About This Home
This home is located at 819 S 13th St, Kingfisher, OK 73750 and is currently estimated at $274,486, approximately $128 per square foot. 819 S 13th St is a home located in Kingfisher County with nearby schools including Gilmour Elementary School, Kingfisher Middle School, and Kingfisher High School.
Ownership History
Date
Name
Owned For
Owner Type
Purchase Details
Closed on
Feb 1, 2021
Sold by
Lott Domni R
Bought by
Boyle Domni R
Current Estimated Value
Purchase Details
Closed on
Aug 4, 2020
Sold by
Lott Domni R and Lott Kendon L
Bought by
Lott Domni R
Purchase Details
Closed on
Nov 15, 2019
Sold by
Rehrman Domni R
Bought by
Lott Domni R and Lott Kendon L
Purchase Details
Closed on
Jun 18, 2019
Sold by
Reherman Justin F
Bought by
Reherman Domni R
Purchase Details
Closed on
Sep 2, 2011
Sold by
Butts Shawna and Butts Shawna Lee
Bought by
Reherman Justin F and Reherman Domni R
Home Financials for this Owner
Home Financials are based on the most recent Mortgage that was taken out on this home.
Original Mortgage
$160,103
Outstanding Balance
$110,524
Interest Rate
4.43%
Mortgage Type
New Conventional
Estimated Equity
$163,962
Create a Home Valuation Report for This Property
The Home Valuation Report is an in-depth analysis detailing your home's value as well as a comparison with similar homes in the area
Home Values in the Area
Average Home Value in this Area
Purchase History
| Date | Buyer | Sale Price | Title Company |
|---|---|---|---|
| Boyle Domni R | -- | None Available | |
| Lott Domni R | -- | None Available | |
| Lott Domni R | -- | None Available | |
| Reherman Domni R | -- | None Available | |
| Reherman Justin F | $154,500 | Solomon Abstract Company | |
| Butts Shawna | -- | Soloman Abstract Company |
Source: Public Records
Mortgage History
| Date | Status | Borrower | Loan Amount |
|---|---|---|---|
| Open | Reherman Justin F | $160,103 |
Source: Public Records
Tax History Compared to Growth
Tax History
| Year | Tax Paid | Tax Assessment Tax Assessment Total Assessment is a certain percentage of the fair market value that is determined by local assessors to be the total taxable value of land and additions on the property. | Land | Improvement |
|---|---|---|---|---|
| 2024 | $1,506 | $18,684 | $1,922 | $16,762 |
| 2023 | $1,459 | $18,140 | $1,646 | $16,494 |
| 2022 | $1,487 | $18,140 | $1,646 | $16,494 |
| 2021 | $1,499 | $18,140 | $1,646 | $16,494 |
| 2020 | $1,493 | $18,140 | $1,646 | $16,494 |
| 2019 | $1,457 | $18,371 | $1,646 | $16,725 |
| 2018 | $1,410 | $17,836 | $1,646 | $16,190 |
| 2017 | $1,438 | $17,317 | $1,646 | $15,671 |
| 2016 | $1,488 | $17,956 | $1,646 | $16,310 |
| 2015 | $1,454 | $17,505 | $730 | $16,775 |
| 2014 | $1,446 | $16,995 | $2,200 | $14,795 |
Source: Public Records
Map
Nearby Homes
- 0 W Fay Ave
- 602 W Oklahoma Ave
- 722 S 10th St
- 904 N Park Place
- 806 Chateau Ct
- 716 S 9th St
- 723 S 9th St
- 615 S 9th St
- 1202 S 13th St
- 1012 S 8th St
- 912 W Overstreet Ave
- 1205 Francis Ln
- 504 S Main St
- 1302 S 8th St
- 1314 S 10th St
- 602 S 6th St
- 1212 S Main St
- 212 E Oklahoma Ave
- 226 E Oklahoma Ave
- 309 S 6th St