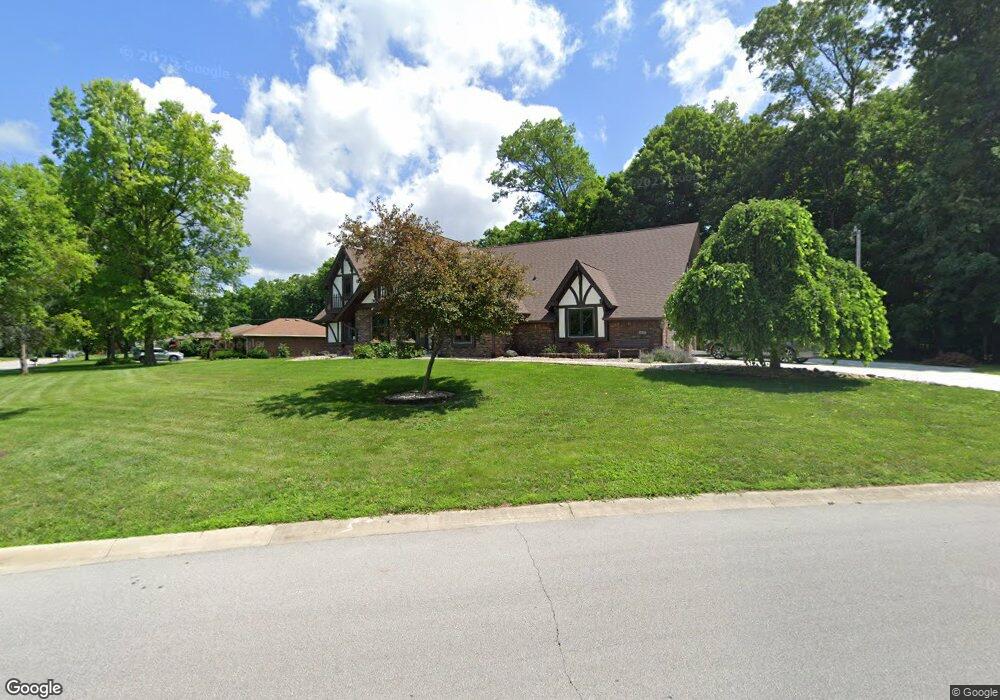
819 S Restin Rd Greenwood, IN 46142
Frances-Stones Crossing NeighborhoodEstimated Value: $470,000 - $563,000
5
Beds
4
Baths
4,438
Sq Ft
$114/Sq Ft
Est. Value
About This Home
This home is located at 819 S Restin Rd, Greenwood, IN 46142 and is currently estimated at $505,293, approximately $113 per square foot. 819 S Restin Rd is a home located in Johnson County with nearby schools including North Grove Elementary School, Center Grove Middle School North, and Center Grove High School.
Ownership History
Date
Name
Owned For
Owner Type
Purchase Details
Closed on
Jun 17, 2020
Sold by
Bruner Thomas and Bruner Tracy J
Bought by
Bruner Thomas L and Bruner Tracy J
Current Estimated Value
Purchase Details
Closed on
Feb 29, 2012
Sold by
Flagstar Bank Fsb
Bought by
Bruner Thomas and Bruner Tracy J
Home Financials for this Owner
Home Financials are based on the most recent Mortgage that was taken out on this home.
Original Mortgage
$142,400
Outstanding Balance
$97,959
Interest Rate
3.9%
Mortgage Type
New Conventional
Estimated Equity
$407,334
Purchase Details
Closed on
Sep 15, 2011
Sold by
Lines Judy L and Lines Judy
Bought by
Flagstar Bank Fsb
Purchase Details
Closed on
Aug 24, 2007
Sold by
Hsbc Bank Usa Na
Bought by
Lines Judy
Home Financials for this Owner
Home Financials are based on the most recent Mortgage that was taken out on this home.
Original Mortgage
$220,000
Interest Rate
6.63%
Mortgage Type
New Conventional
Purchase Details
Closed on
Jun 21, 2007
Sold by
Flemming Mary L and Helphensline Danny
Bought by
Hsbc Bank Usa N A
Create a Home Valuation Report for This Property
The Home Valuation Report is an in-depth analysis detailing your home's value as well as a comparison with similar homes in the area
Home Values in the Area
Average Home Value in this Area
Purchase History
| Date | Buyer | Sale Price | Title Company |
|---|---|---|---|
| Bruner Thomas L | -- | None Available | |
| Bruner Thomas | -- | None Available | |
| Flagstar Bank Fsb | $216,750 | None Available | |
| Lines Judy | $220,000 | Rels Title/Ati Title | |
| Hsbc Bank Usa N A | $244,900 | None Available |
Source: Public Records
Mortgage History
| Date | Status | Borrower | Loan Amount |
|---|---|---|---|
| Open | Bruner Thomas | $142,400 | |
| Previous Owner | Lines Judy | $220,000 |
Source: Public Records
Tax History Compared to Growth
Tax History
| Year | Tax Paid | Tax Assessment Tax Assessment Total Assessment is a certain percentage of the fair market value that is determined by local assessors to be the total taxable value of land and additions on the property. | Land | Improvement |
|---|---|---|---|---|
| 2025 | $3,975 | $390,600 | $68,100 | $322,500 |
| 2024 | $3,975 | $397,500 | $68,100 | $329,400 |
| 2023 | $3,908 | $397,500 | $68,100 | $329,400 |
| 2022 | $3,617 | $362,200 | $63,900 | $298,300 |
| 2021 | $2,750 | $293,100 | $53,500 | $239,600 |
| 2020 | $2,582 | $283,600 | $44,000 | $239,600 |
| 2019 | $2,489 | $273,400 | $44,000 | $229,400 |
| 2018 | $2,466 | $280,700 | $44,000 | $236,700 |
| 2017 | $2,473 | $271,500 | $39,200 | $232,300 |
| 2016 | $2,274 | $256,700 | $39,200 | $217,500 |
| 2014 | $2,344 | $254,300 | $39,200 | $215,100 |
| 2013 | $2,344 | $253,900 | $39,200 | $214,700 |
Source: Public Records
Map
Nearby Homes
- 784 S Restin Rd
- 3110 W Smith Valley Rd
- 3368 Johns Way
- 3309 Lukes Way
- 3407 Lukes Way
- 3613 Sugar Maple Ct
- 801 Silverleaf Dr
- 11 N Restin Rd
- 1638 Library Blvd
- 3232 Grace St
- 32 N Restin Rd
- 1081 Rita Dr
- 860 Old Eagle Way
- 386 White Oak Ln
- 3745 Presidents Ln
- 3827 Stonemeadow Dr
- 1564 Chase Blvd
- 1572 Hunters Ln
- 288 Little Ben Ln
- 3895 Harrison Crossing Ln
- 801 S Restin Rd
- 4011 Tarry Ln
- 3078-3194 W Smith Valley Rd
- 4020 Tarry Ln
- 802 S Restin Rd
- 4021 Tarry Ln
- 3162 W Smith Valley Rd
- 3194 W Smith Valley Rd
- 4032 Tarry Ln
- 4033 Tarry Ln
- 779 S Restin Rd
- 3222 W Smith Valley Rd
- 3154 W Smith Valley Rd
- 3186 W Smith Valley Rd
- 780 S Restin Rd
- 3142 W Smith Valley Rd
- 3254 W Smith Valley Rd
- 81 Tarry Ct
- 4047 Tarry Ln