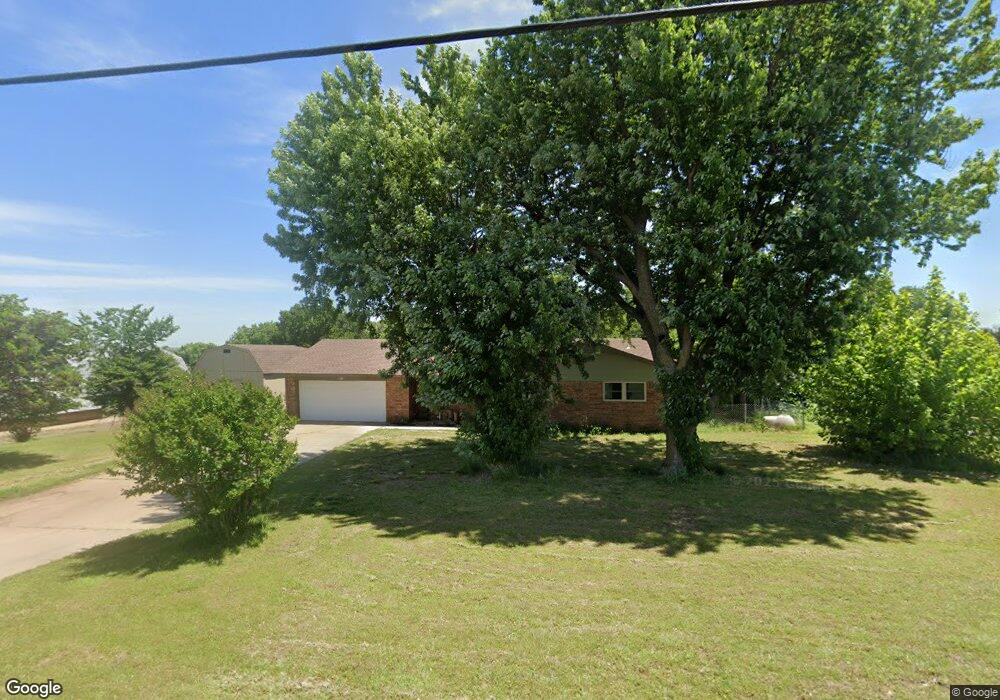
819 S Shepard Ave El Reno, OK 73036
Estimated Value: $165,000 - $181,000
3
Beds
2
Baths
1,374
Sq Ft
$126/Sq Ft
Est. Value
About This Home
This home is located at 819 S Shepard Ave, El Reno, OK 73036 and is currently estimated at $173,638, approximately $126 per square foot. 819 S Shepard Ave is a home located in Canadian County with nearby schools including Hillcrest Elementary School, Rose Witcher Elementary School, and Lincoln Learning Center.
Ownership History
Date
Name
Owned For
Owner Type
Purchase Details
Closed on
Aug 16, 2024
Sold by
Decker Rebecca M and Decker-Carter Rebecca M
Bought by
Davis Derek and Davis Marissa
Current Estimated Value
Home Financials for this Owner
Home Financials are based on the most recent Mortgage that was taken out on this home.
Original Mortgage
$110,000
Outstanding Balance
$108,774
Interest Rate
6.95%
Mortgage Type
New Conventional
Estimated Equity
$64,864
Purchase Details
Closed on
Oct 29, 2021
Sold by
Legg Ray Mark and Legg Robyn Maureen
Bought by
Decker Rebecca M
Home Financials for this Owner
Home Financials are based on the most recent Mortgage that was taken out on this home.
Original Mortgage
$154,660
Interest Rate
2.8%
Mortgage Type
FHA
Purchase Details
Closed on
Nov 21, 2016
Sold by
Legg Ray M and Legg Robyn M
Bought by
Legg Ray Mark and Legg Robyn Maureen Shelley
Purchase Details
Closed on
Jan 11, 2006
Sold by
George Jacky and Legg Mark
Bought by
London And Macomb Church Of Christ Of El
Create a Home Valuation Report for This Property
The Home Valuation Report is an in-depth analysis detailing your home's value as well as a comparison with similar homes in the area
Home Values in the Area
Average Home Value in this Area
Purchase History
| Date | Buyer | Sale Price | Title Company |
|---|---|---|---|
| Davis Derek | $170,000 | Element Title | |
| Decker Rebecca M | $160,000 | Old Republic Title | |
| Legg Ray Mark | -- | None Available | |
| London And Macomb Church Of Christ Of El | -- | None Available |
Source: Public Records
Mortgage History
| Date | Status | Borrower | Loan Amount |
|---|---|---|---|
| Open | Davis Derek | $110,000 | |
| Previous Owner | Decker Rebecca M | $154,660 |
Source: Public Records
Tax History Compared to Growth
Tax History
| Year | Tax Paid | Tax Assessment Tax Assessment Total Assessment is a certain percentage of the fair market value that is determined by local assessors to be the total taxable value of land and additions on the property. | Land | Improvement |
|---|---|---|---|---|
| 2024 | $1,417 | $13,886 | $900 | $12,986 |
| 2023 | $1,417 | $13,225 | $900 | $12,325 |
| 2022 | $1,324 | $12,309 | $900 | $11,409 |
| 2021 | $1,339 | $12,150 | $900 | $11,250 |
| 2020 | $1,322 | $12,150 | $900 | $11,250 |
| 2019 | $1,336 | $11,755 | $900 | $10,855 |
| 2018 | $1,260 | $11,195 | $900 | $10,295 |
| 2017 | $1,223 | $10,662 | $900 | $9,762 |
| 2016 | $1,173 | $10,662 | $900 | $9,762 |
| 2015 | -- | $9,671 | $900 | $8,771 |
| 2014 | -- | $9,210 | $900 | $8,310 |
Source: Public Records
Map
Nearby Homes
- 1101 Gabriel St
- 1621 Chuck Wagon Dr
- 1608 Chuck Wagon Dr
- 1607 Chuck Wagon Dr
- 1207 Heritage Dr
- 1219 Heritage Dr
- 1117 SW Heritage Dr
- 313 Hal Dr
- 1008 E Woodson St
- 100 N Donald Ave
- 900 E Woodson St
- 120 N Donald Ave
- 101 N El Reno Ave
- 811 S Hoff Ave
- 603 E Wade St
- 221 N L Ave
- 819 S Macomb Ave
- 118 N Foster Ave
- 228 N Donald Ave
- 600 S Macomb Ave
- 801 S Shepard Ave
- 901 S Shepard Ave
- 721 S Shepard Ave
- 1601 E Bradley Dr
- 910 S Shepard Ave
- 910 S Shepard Ave
- 1700 E Scotty Way
- 1701 E Cavanaugh St
- 1701 E Scotty Way
- 717 S Shepard Ave
- 1320 E Cavanaugh St Unit 1322
- 1320 E Cavanaugh St
- 1700 E Cavanaugh St
- 1701 E Bradley Dr
- 1316 E Cavanaugh St
- 915 S Shepard Ave
- 1321 E Ash St
- 1700 E Bradley Dr
- 1312 E Cavanaugh St
- 1317 E Ash St