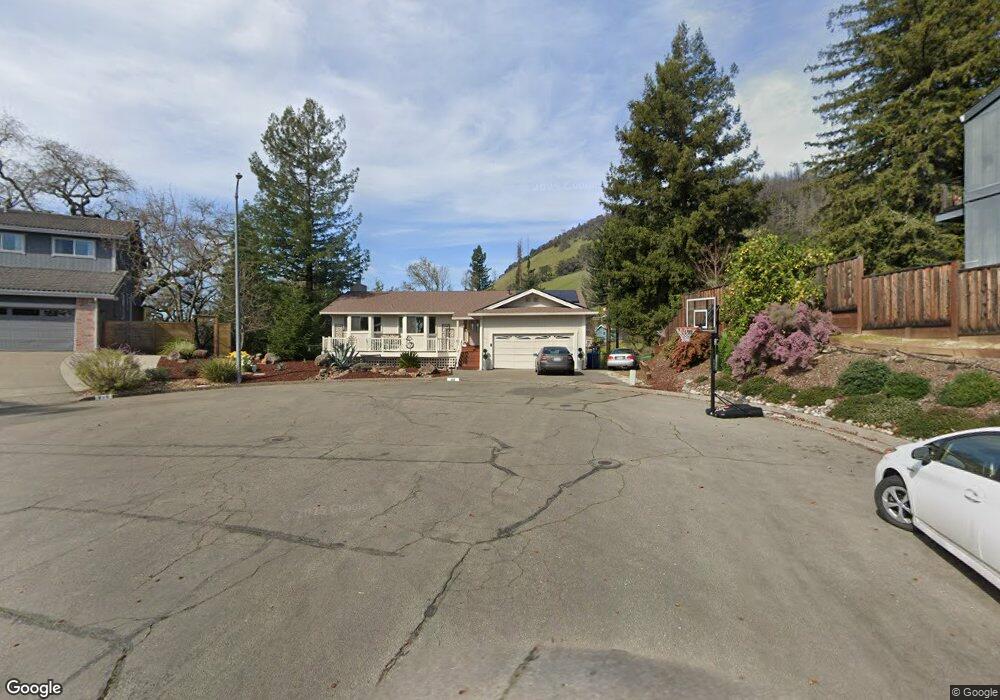
819 Sentinel Ct Santa Rosa, CA 95409
Skyhawk NeighborhoodEstimated Value: $969,000 - $1,243,000
4
Beds
3
Baths
2,524
Sq Ft
$428/Sq Ft
Est. Value
About This Home
This home is located at 819 Sentinel Ct, Santa Rosa, CA 95409 and is currently estimated at $1,079,556, approximately $427 per square foot. 819 Sentinel Ct is a home located in Sonoma County with nearby schools including Sequoia Elementary School, Rincon Valley Middle School, and Maria Carrillo High School.
Ownership History
Date
Name
Owned For
Owner Type
Purchase Details
Closed on
Dec 23, 2002
Sold by
Reynolds Dolores L and Alatorre Dolores L
Bought by
Flores Robert E and Flores Victoria L
Current Estimated Value
Home Financials for this Owner
Home Financials are based on the most recent Mortgage that was taken out on this home.
Original Mortgage
$424,000
Interest Rate
6.06%
Purchase Details
Closed on
Jul 14, 1999
Sold by
Alatorre Rod H
Bought by
Alatorre Dolores L
Create a Home Valuation Report for This Property
The Home Valuation Report is an in-depth analysis detailing your home's value as well as a comparison with similar homes in the area
Home Values in the Area
Average Home Value in this Area
Purchase History
| Date | Buyer | Sale Price | Title Company |
|---|---|---|---|
| Flores Robert E | $530,000 | First American Title Co | |
| Reynolds Dolores L | -- | First American Title Co | |
| Alatorre Dolores L | -- | -- |
Source: Public Records
Mortgage History
| Date | Status | Borrower | Loan Amount |
|---|---|---|---|
| Closed | Flores Robert E | $424,000 |
Source: Public Records
Tax History Compared to Growth
Tax History
| Year | Tax Paid | Tax Assessment Tax Assessment Total Assessment is a certain percentage of the fair market value that is determined by local assessors to be the total taxable value of land and additions on the property. | Land | Improvement |
|---|---|---|---|---|
| 2025 | $8,866 | $767,619 | $260,697 | $506,922 |
| 2024 | $8,866 | $752,569 | $255,586 | $496,983 |
| 2023 | $8,866 | $737,814 | $250,575 | $487,239 |
| 2022 | $8,185 | $723,348 | $245,662 | $477,686 |
| 2021 | $8,021 | $709,166 | $240,846 | $468,320 |
| 2020 | $7,991 | $701,895 | $238,377 | $463,518 |
| 2019 | $7,917 | $688,133 | $233,703 | $454,430 |
| 2018 | $7,868 | $674,641 | $229,121 | $445,520 |
| 2017 | $7,724 | $661,414 | $224,629 | $436,785 |
| 2016 | $7,647 | $648,446 | $220,225 | $428,221 |
| 2015 | $7,499 | $638,707 | $216,918 | $421,789 |
| 2014 | $6,368 | $550,000 | $187,000 | $363,000 |
Source: Public Records
Map
Nearby Homes
- 5243 Beaumont Way
- 5198 Parkhurst Dr
- 28 Springhill Ct
- 31 Springhill Ct
- 29 Coronado Cir
- 48 Shadyleaf Ct
- 5209 San Luis Ave
- 71 Oakcreek Ct
- 52 Oakstone Ct Unit 52
- 66 Coronado Cir
- 61 Coronado Cir
- 164 Brookview Ct
- 537 Emerald Park Ct
- 103 Glenoak Ct
- 305 Simone Place N
- 5518 Marit Dr
- 311 Algiers Ct
- 5015 Charmian Dr
- 4894 Wagon Wheel Ln
- 1826 San Ramon Way
- 815 Sentinel Ct
- 821 Vaughn Ct
- 813 Sentinel Ct
- 5254 Beaumont Way
- 827 Vaughn Ct
- 807 Sentinel Ct
- 811 Sentinel Ct
- 835 Vaughn Ct
- 803 Sentinel Ct
- 5244 Beaumont Way
- 804 Sentinel Ct
- 822 Vaughn Ct
- 826 Vaughn Ct
- 761 Montclair Dr
- 5255 Beaumont Way
- 5236 Beaumont Way
- 757 Montclair Dr
- 765 Montclair Dr
- 844 Vaughn Ct
- 5230 Beaumont Way