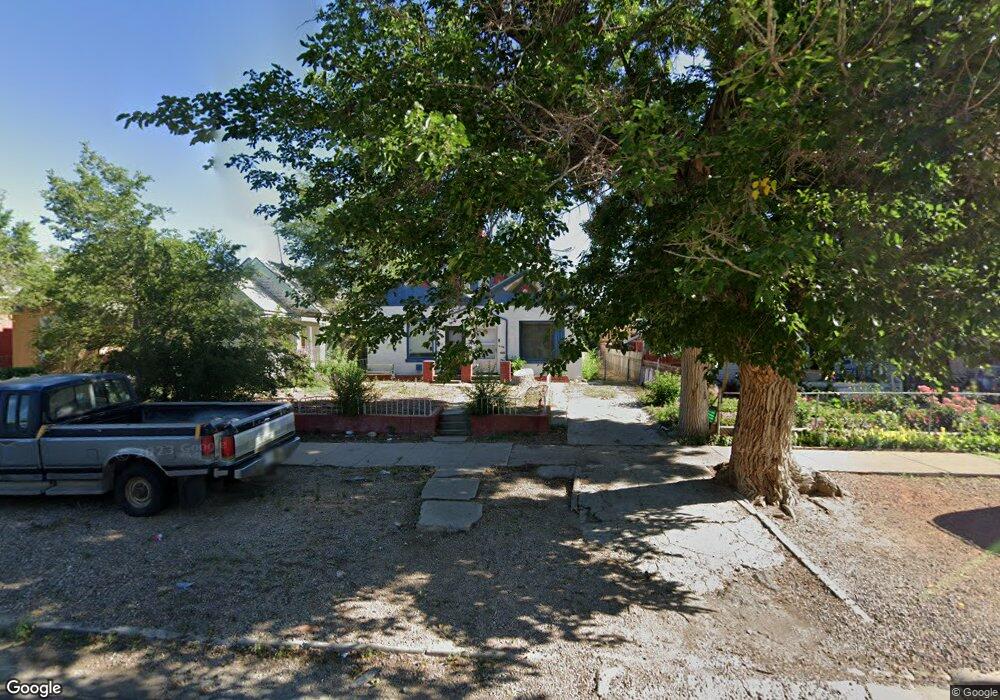
819 W 11th St Pueblo, CO 81003
Northside NeighborhoodEstimated Value: $232,644 - $283,000
3
Beds
2
Baths
1,978
Sq Ft
$132/Sq Ft
Est. Value
About This Home
This home is located at 819 W 11th St, Pueblo, CO 81003 and is currently estimated at $261,215, approximately $132 per square foot. 819 W 11th St is a home located in Pueblo County with nearby schools including Irving Elementary School, Risley International Academy of Innovation, and Centennial High School.
Ownership History
Date
Name
Owned For
Owner Type
Purchase Details
Closed on
Feb 18, 1993
Sold by
Neighborhood Service
Bought by
Neighborhood Services Inc
Current Estimated Value
Purchase Details
Closed on
Aug 31, 1988
Sold by
Rivera Lillian Joan
Bought by
Neighborhood Service
Purchase Details
Closed on
Feb 24, 1988
Sold by
Pueblo Commercial Cred Ind Bnk
Bought by
Rivera Lillian Joan
Purchase Details
Closed on
Dec 21, 1987
Sold by
Mason Phyllis
Bought by
Pueblo Commercial Cred Ind Bnk
Purchase Details
Closed on
Nov 8, 1985
Sold by
Mason Phyllis + Les
Bought by
Mason Phyllis
Purchase Details
Closed on
Oct 28, 1983
Sold by
Klingaman Marie M + George C
Bought by
Mason Phyllis + Les
Purchase Details
Closed on
Dec 16, 1982
Sold by
Klingaman Marie M
Bought by
Klingaman Marie M + George C
Purchase Details
Closed on
Mar 14, 1975
Sold by
Klingman George C + Marie M
Bought by
Klingaman Marie M
Create a Home Valuation Report for This Property
The Home Valuation Report is an in-depth analysis detailing your home's value as well as a comparison with similar homes in the area
Home Values in the Area
Average Home Value in this Area
Purchase History
| Date | Buyer | Sale Price | Title Company |
|---|---|---|---|
| Neighborhood Services Inc | $10,000 | -- | |
| Neighborhood Service | -- | -- | |
| Rivera Lillian Joan | $33,000 | -- | |
| Pueblo Commercial Cred Ind Bnk | -- | -- | |
| Mason Phyllis | -- | -- | |
| Mason Phyllis + Les | $48,500 | -- | |
| Klingaman Marie M + George C | -- | -- | |
| Klingaman Marie M | -- | -- |
Source: Public Records
Tax History Compared to Growth
Tax History
| Year | Tax Paid | Tax Assessment Tax Assessment Total Assessment is a certain percentage of the fair market value that is determined by local assessors to be the total taxable value of land and additions on the property. | Land | Improvement |
|---|---|---|---|---|
| 2024 | $1,414 | $14,420 | -- | -- |
| 2023 | $1,429 | $18,110 | $940 | $17,170 |
| 2022 | $792 | $7,970 | $320 | $7,650 |
| 2021 | $1,104 | $11,140 | $340 | $10,800 |
| 2020 | $703 | $11,140 | $340 | $10,800 |
| 2019 | $703 | $6,961 | $255 | $6,706 |
| 2018 | $510 | $5,629 | $256 | $5,373 |
| 2017 | $515 | $5,629 | $256 | $5,373 |
| 2016 | $525 | $5,782 | $283 | $5,499 |
| 2015 | $262 | $5,782 | $283 | $5,499 |
| 2014 | $508 | $5,605 | $283 | $5,322 |
Source: Public Records
Map
Nearby Homes
- 824 W 11th St
- 930 W 11th St
- 825 W 12th St
- 1019 West St
- 1021 West St
- 1119 West St
- 726 W 13th St
- 914 W 13th St
- 624 W 11th St
- 909 W 13th St
- 701 W 13th St
- 1015 W 13th St Unit 1-4
- 1015 W 13th St
- 609 W 8th St Unit 611
- 520 W 11th St
- 519 W 11th St Unit U CHOOSE
- 519 W 11th St
- 1007 W 14th St
- 1127 W 12th St
- 525 W 7th St