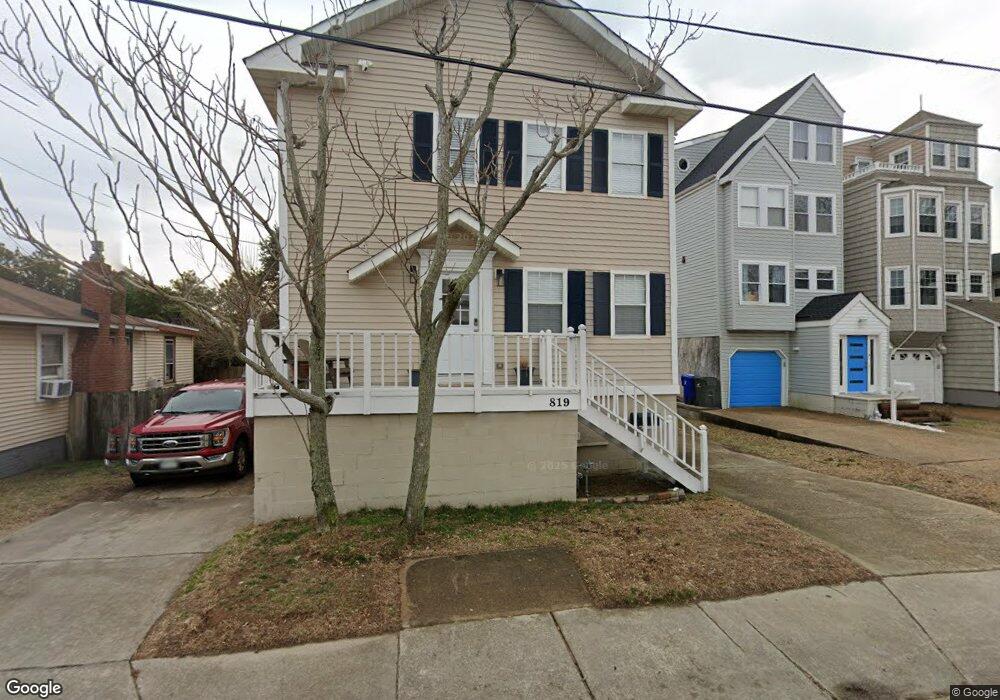
819 W Ocean View Ave Norfolk, VA 23503
Willoughby NeighborhoodEstimated Value: $329,636 - $462,000
3
Beds
2
Baths
1,296
Sq Ft
$291/Sq Ft
Est. Value
About This Home
This home is located at 819 W Ocean View Ave, Norfolk, VA 23503 and is currently estimated at $377,159, approximately $291 per square foot. 819 W Ocean View Ave is a home located in Norfolk City with nearby schools including Ocean View Elementary School, Northside Middle School, and Granby High School.
Ownership History
Date
Name
Owned For
Owner Type
Purchase Details
Closed on
Apr 18, 2025
Sold by
Blomdahl Seth A
Bought by
Blomdahl Seth A and Hawkins Hadley J
Current Estimated Value
Purchase Details
Closed on
May 26, 2023
Sold by
Gloria B Thornton Revocable Trust and Stant Frederick T
Bought by
819W Ocean View Duplex Llc
Home Financials for this Owner
Home Financials are based on the most recent Mortgage that was taken out on this home.
Original Mortgage
$211,105
Interest Rate
6.43%
Mortgage Type
FHA
Purchase Details
Closed on
May 25, 2023
Sold by
819 W Ocean View Duplex Llc
Bought by
Blomdahl Seth A
Home Financials for this Owner
Home Financials are based on the most recent Mortgage that was taken out on this home.
Original Mortgage
$211,105
Interest Rate
6.43%
Mortgage Type
FHA
Purchase Details
Closed on
Sep 15, 2022
Sold by
Stant Frederick T
Bought by
819 W Ocean View Duplex Llc
Purchase Details
Closed on
Aug 8, 2022
Sold by
Thornton Gloria B
Bought by
819 Ocean View Duplex Llc
Create a Home Valuation Report for This Property
The Home Valuation Report is an in-depth analysis detailing your home's value as well as a comparison with similar homes in the area
Home Values in the Area
Average Home Value in this Area
Purchase History
| Date | Buyer | Sale Price | Title Company |
|---|---|---|---|
| Blomdahl Seth A | -- | Fidelity National Title | |
| 819W Ocean View Duplex Llc | -- | None Listed On Document | |
| Blomdahl Seth A | $215,000 | Fidelity National Title | |
| 819 W Ocean View Duplex Llc | -- | None Listed On Document | |
| 819 Ocean View Duplex Llc | -- | Reilly Cartwright Rixey |
Source: Public Records
Mortgage History
| Date | Status | Borrower | Loan Amount |
|---|---|---|---|
| Previous Owner | Blomdahl Seth A | $211,105 |
Source: Public Records
Tax History Compared to Growth
Tax History
| Year | Tax Paid | Tax Assessment Tax Assessment Total Assessment is a certain percentage of the fair market value that is determined by local assessors to be the total taxable value of land and additions on the property. | Land | Improvement |
|---|---|---|---|---|
| 2025 | $3,450 | $276,000 | $92,500 | $183,500 |
| 2024 | $3,362 | $273,300 | $92,500 | $180,800 |
| 2023 | $2,994 | $239,500 | $92,500 | $147,000 |
| 2022 | $2,659 | $212,700 | $80,000 | $132,700 |
| 2021 | $2,454 | $196,300 | $80,000 | $116,300 |
| 2020 | $2,390 | $191,200 | $80,000 | $111,200 |
| 2019 | $2,299 | $183,900 | $80,000 | $103,900 |
| 2018 | $2,250 | $180,000 | $80,000 | $100,000 |
| 2017 | $1,984 | $172,500 | $76,000 | $96,500 |
| 2016 | $1,984 | $144,500 | $76,000 | $68,500 |
| 2015 | $1,662 | $144,500 | $76,000 | $68,500 |
| 2014 | $1,662 | $144,500 | $76,000 | $68,500 |
Source: Public Records
Map
Nearby Homes
- 831 W Ocean View Ave
- 9711 8th View St Unit 11
- 839 Little Bay Ave Unit 13
- 835 Little Bay Ave Unit 32
- 865 Little Bay Ave Unit 5
- 914 W Ocean View Ave Unit 202
- 737 W Ocean View Ave Unit A
- 947 Little Bay Ave
- 949 Little Bay Ave
- 1039 Little Bay Ave
- 600 W Ocean View Ave Unit C
- 9628 11th View St
- 1080 W Ocean View Ave Unit D
- 1135 Little Bay Ave
- 504 W Ocean View Ave
- 9724 12th View St
- 1106 Toler Place
- 1233 Little Bay Ave
- 1268 Little Bay Ave Unit 12
- 360 Staten St
- 821 W Ocean View Ave
- 825 W Ocean View Ave
- 815 W Ocean View Ave
- 829 W Ocean View Ave
- 818 Willoughby Bay Ave
- 818 Willoughby Bay Ave
- 820 Willoughby Bay Ave
- 814 Willoughby Bay Ave
- 822 Little Bay Ave
- 822 Willoughby Bay Ave
- 822 Willoughby Bay Ave
- 839 W Ocean View Ave Unit 16
- 839 W Ocean View Ave Unit 15
- 839 W Ocean View Ave Unit 14
- 839 W Ocean View Ave Unit 13
- 839 W Ocean View Ave Unit 12
- 839 W Ocean View Ave Unit 11
- 839 W Ocean View Ave Unit 10
- 839 W Ocean View Ave Unit 9
- 839 W Ocean View Ave