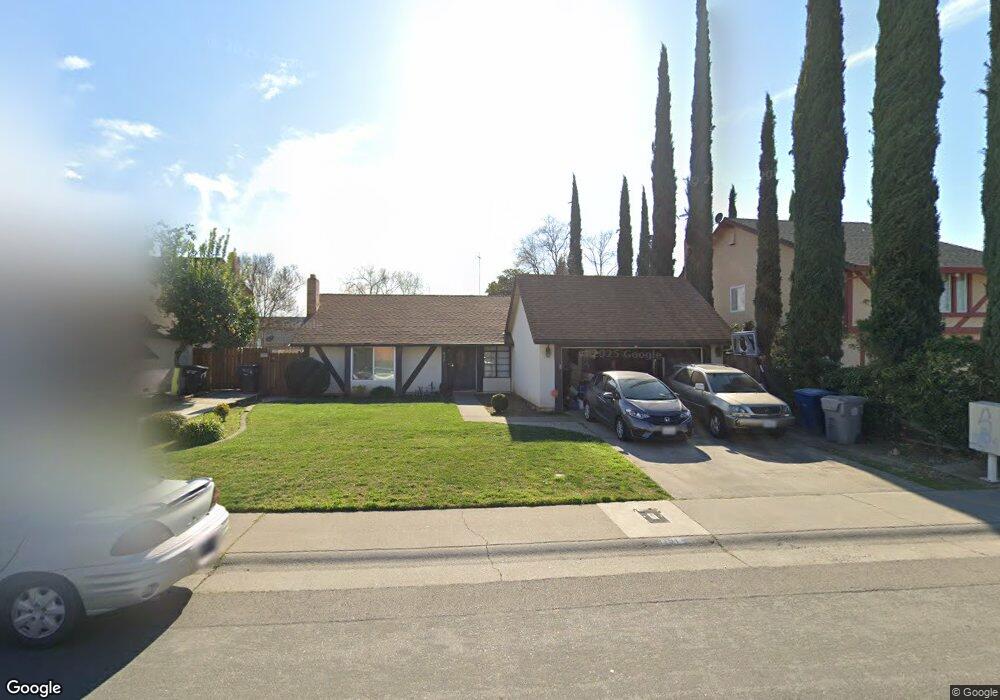
8191 Gandy Dancer Way Sacramento, CA 95823
North Laguna NeighborhoodEstimated Value: $395,000 - $494,000
4
Beds
2
Baths
1,768
Sq Ft
$258/Sq Ft
Est. Value
About This Home
This home is located at 8191 Gandy Dancer Way, Sacramento, CA 95823 and is currently estimated at $455,990, approximately $257 per square foot. 8191 Gandy Dancer Way is a home located in Sacramento County with nearby schools including Herman Leimbach Elementary School, Samuel Jackman Middle School, and Valley High School.
Ownership History
Date
Name
Owned For
Owner Type
Purchase Details
Closed on
Jul 22, 2014
Sold by
Spencer Eugene J
Bought by
Spencer Disarie R
Current Estimated Value
Purchase Details
Closed on
May 18, 2006
Sold by
Spencer Eugene J and Spencer Disarie R
Bought by
Spencer Eugene J and Spencer Disarie R
Home Financials for this Owner
Home Financials are based on the most recent Mortgage that was taken out on this home.
Original Mortgage
$245,000
Outstanding Balance
$150,628
Interest Rate
7.5%
Mortgage Type
New Conventional
Estimated Equity
$305,362
Purchase Details
Closed on
Dec 9, 1998
Sold by
Cloninger Christie N and Cloninger Leonard
Bought by
Spencer Eugene J and Spencer Disarie R
Home Financials for this Owner
Home Financials are based on the most recent Mortgage that was taken out on this home.
Original Mortgage
$108,998
Interest Rate
6.78%
Mortgage Type
FHA
Purchase Details
Closed on
Jul 13, 1998
Sold by
Cloninger Christie N
Bought by
Cloninger Leonard and Cloninger Christie N
Create a Home Valuation Report for This Property
The Home Valuation Report is an in-depth analysis detailing your home's value as well as a comparison with similar homes in the area
Home Values in the Area
Average Home Value in this Area
Purchase History
| Date | Buyer | Sale Price | Title Company |
|---|---|---|---|
| Spencer Disarie R | -- | None Available | |
| Spencer Eugene J | -- | Financial Title Company | |
| Spencer Eugene J | $110,000 | Old Republic Title Company | |
| Cloninger Leonard | -- | -- |
Source: Public Records
Mortgage History
| Date | Status | Borrower | Loan Amount |
|---|---|---|---|
| Open | Spencer Eugene J | $245,000 | |
| Closed | Spencer Eugene J | $108,998 |
Source: Public Records
Tax History Compared to Growth
Tax History
| Year | Tax Paid | Tax Assessment Tax Assessment Total Assessment is a certain percentage of the fair market value that is determined by local assessors to be the total taxable value of land and additions on the property. | Land | Improvement |
|---|---|---|---|---|
| 2025 | $2,056 | $172,337 | $39,180 | $133,157 |
| 2024 | $2,056 | $168,959 | $38,412 | $130,547 |
| 2023 | $1,997 | $165,647 | $37,659 | $127,988 |
| 2022 | $1,975 | $162,400 | $36,921 | $125,479 |
| 2021 | $1,943 | $159,217 | $36,198 | $123,019 |
| 2020 | $1,911 | $157,585 | $35,827 | $121,758 |
| 2019 | $1,877 | $154,496 | $35,125 | $119,371 |
| 2018 | $1,826 | $151,468 | $34,437 | $117,031 |
| 2017 | $2,050 | $148,499 | $33,762 | $114,737 |
| 2016 | $2,558 | $145,588 | $33,100 | $112,488 |
| 2015 | $3,669 | $143,402 | $32,603 | $110,799 |
| 2014 | $4,173 | $140,594 | $31,965 | $108,629 |
Source: Public Records
Map
Nearby Homes
- 8210 Gandy Dancer Way
- 57 Kennelford Cir
- 8216 Center Pkwy
- 8220 Center Pkwy Unit 38
- 8228 Center Pkwy Unit 46
- 8115 Gandy Dancer Way
- 8200 Center Pkwy Unit 9
- 8244 Center Pkwy Unit 65
- 8252 Center Pkwy
- 8252 Center Pkwy
- 6028 Hollyhurst Way
- 6330 Valley hi Dr
- 8272 Center Pkwy Unit 111
- 44 Hallowell Ct
- 62 Hallowell Ct
- 39 Hallowell Ct
- 45 Hallowell Ct
- 51 Hallowell Ct
- 57 Hallowell Ct
- 63 Hallowell Ct
- 8187 Gandy Dancer Way
- 8195 Gandy Dancer Way
- 8360 Arroyo Vista Dr
- 8356 Arroyo Vista Dr
- 8364 Arroyo Vista Dr
- 8183 Gandy Dancer Way
- 8190 Gandy Dancer Way
- 8352 Arroyo Vista Dr
- 8194 Gandy Dancer Way
- 8186 Gandy Dancer Way
- 8198 Gandy Dancer Way
- 8348 Arroyo Vista Dr
- 8179 Gandy Dancer Way
- 8206 Gandy Dancer Way
- 8214 Gandy Dancer Way
- 8175 Gandy Dancer Way
- 8202 Gandy Dancer Way
- 8218 Gandy Dancer Way
- 8344 Arroyo Vista Dr
- 8171 Gandy Dancer Way