8191 Hines Rd Millington, TN 38053
Estimated Value: $279,658 - $369,000
4
Beds
2
Baths
2,580
Sq Ft
$120/Sq Ft
Est. Value
About This Home
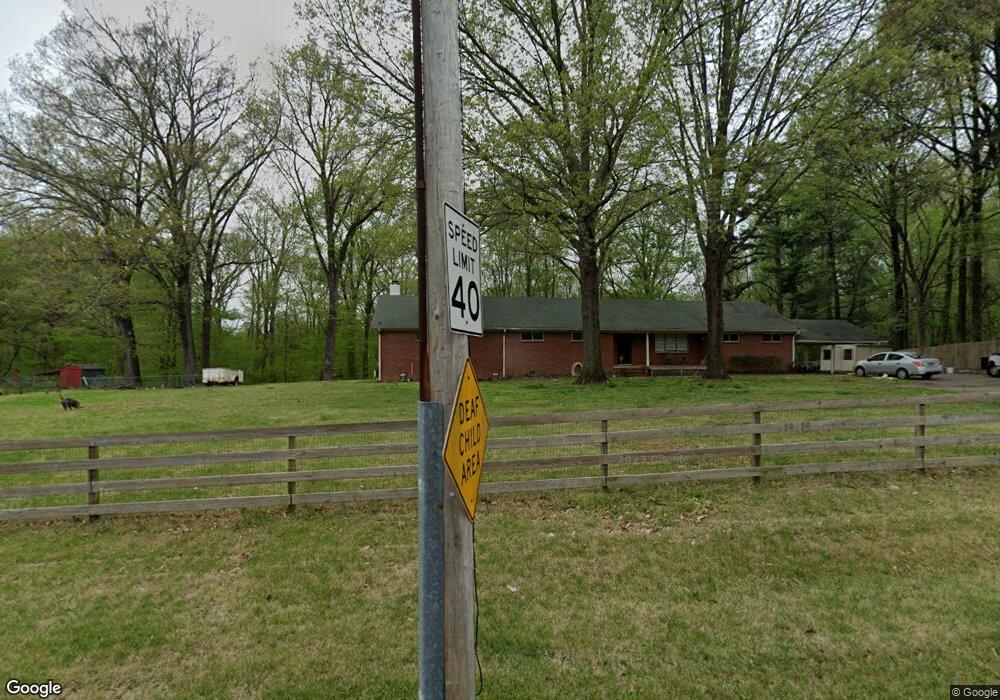
This home is located at 8191 Hines Rd, Millington, TN 38053 and is currently estimated at $310,165, approximately $120 per square foot. 8191 Hines Rd is a home located in Shelby County with nearby schools including E.E. Jeter Elementary School and Trezevant High School.
Ownership History
Date
Name
Owned For
Owner Type
Purchase Details
Closed on
Feb 8, 2021
Sold by
Hubbard Jeanne Thompson
Bought by
Hubbard Russell
Current Estimated Value
Home Financials for this Owner
Home Financials are based on the most recent Mortgage that was taken out on this home.
Original Mortgage
$114,275
Outstanding Balance
$102,206
Interest Rate
2.7%
Mortgage Type
New Conventional
Estimated Equity
$207,959
Purchase Details
Closed on
Nov 26, 2002
Sold by
Wallace Gary F and Wallace Patricia C
Bought by
Hubbard Russell C
Home Financials for this Owner
Home Financials are based on the most recent Mortgage that was taken out on this home.
Original Mortgage
$118,146
Interest Rate
6.3%
Mortgage Type
FHA
Purchase Details
Closed on
Dec 16, 1998
Sold by
Wilson Wallace Patrica Ann and Wilson Gary F
Bought by
Wallace Gary F and Wallace Patricia C
Create a Home Valuation Report for This Property
The Home Valuation Report is an in-depth analysis detailing your home's value as well as a comparison with similar homes in the area
Home Values in the Area
Average Home Value in this Area
Purchase History
| Date | Buyer | Sale Price | Title Company |
|---|---|---|---|
| Hubbard Russell | -- | None Available | |
| Hubbard Russell C | $120,000 | Realty Title & Escrow Co Inc | |
| Wallace Gary F | -- | -- |
Source: Public Records
Mortgage History
| Date | Status | Borrower | Loan Amount |
|---|---|---|---|
| Open | Hubbard Russell | $114,275 | |
| Closed | Hubbard Russell C | $118,146 |
Source: Public Records
Tax History Compared to Growth
Tax History
| Year | Tax Paid | Tax Assessment Tax Assessment Total Assessment is a certain percentage of the fair market value that is determined by local assessors to be the total taxable value of land and additions on the property. | Land | Improvement |
|---|---|---|---|---|
| 2025 | $1,715 | $68,825 | $4,750 | $64,075 |
| 2024 | $1,715 | $50,600 | $4,525 | $46,075 |
| 2023 | $1,715 | $50,600 | $4,525 | $46,075 |
| 2022 | $1,715 | $50,600 | $4,525 | $46,075 |
| 2021 | $1,746 | $50,600 | $4,525 | $46,075 |
| 2020 | $1,276 | $31,500 | $4,525 | $26,975 |
| 2019 | $1,276 | $31,500 | $4,525 | $26,975 |
| 2018 | $1,276 | $31,500 | $4,525 | $26,975 |
| 2017 | $1,295 | $31,500 | $4,525 | $26,975 |
| 2016 | $1,323 | $30,275 | $0 | $0 |
| 2014 | $1,323 | $30,275 | $0 | $0 |
Source: Public Records
Map
Nearby Homes
- 2078 Russell Bond Rd
- 7790 Deer Lake Dr
- 0 St Paul Rd Unit 10199051
- 1932 Saint Paul Rd
- 7441 Walsh Rd
- 7550 Woodstock Cuba Rd
- 7255 Walsh Rd
- 1907 Campbell Rd
- 8292 Rankin Branch Rd
- 1435 Walsh Cove
- 8370 Rankin Branch Rd
- 7265 Ward Rd
- 6770 Camp John Rd
- 9430 Monasco Rd
- 0 Herring Hill Rd
- 0 N Watkins Unit 10203950
- 0 N Watkins Unit 10193620
- 1 Walsh Rd
- 0 Monasco Rd Unit RTC2990463
- 8205 Shakerag Rd
- 8175 Hines Rd
- 1643 Cuba Millington Rd
- 8192 Hines Rd
- 8153 Hines Rd
- 8180 Hines Rd
- 1561 Cuba Millington Rd
- 1698 Cuba Millington Rd
- 1640 Cuba Millington Rd
- 1586 Cuba Millington Rd
- 1710 Cuba Millington Rd
- 1545 Cuba Millington Rd
- 1730 Cuba Millington Rd
- 8118 Hines Rd
- 1740 Cuba Millington Rd
- 1544 Cuba Millington Rd
- 8076 Hines Rd
- 8140 Hines Rd
- 1750 Cuba Millington Rd
- 1760 Cuba Millington Rd
- 1524 Cuba Millington Rd