8193 NW 8th Manor Plantation, FL 33324
Estimated Value: $194,574 - $276,000
3
Beds
3
Baths
1,690
Sq Ft
$129/Sq Ft
Est. Value
About This Home
This home is located at 8193 NW 8th Manor, Plantation, FL 33324 and is currently estimated at $217,394, approximately $128 per square foot. 8193 NW 8th Manor is a home located in Broward County with nearby schools including Peters Elementary School, Plantation Middle School, and Plantation High School.
Ownership History
Date
Name
Owned For
Owner Type
Purchase Details
Closed on
Jul 30, 2025
Sold by
Brodskaya Liliya
Bought by
Timul Merline
Current Estimated Value
Home Financials for this Owner
Home Financials are based on the most recent Mortgage that was taken out on this home.
Original Mortgage
$199,192
Outstanding Balance
$199,023
Interest Rate
6.81%
Mortgage Type
VA
Estimated Equity
$18,372
Purchase Details
Closed on
Sep 22, 2017
Sold by
Wolf Sean
Bought by
Brodskaya Liliya
Purchase Details
Closed on
Dec 11, 2014
Sold by
Wolf Sean
Bought by
Wolf Sean and Revocable Trust Agreement Of Sean Wolf
Purchase Details
Closed on
Mar 29, 2013
Sold by
Spingarn Susan J
Bought by
Wolf Sean
Purchase Details
Closed on
Jun 3, 1999
Sold by
Woltag Alice
Bought by
Spingarn Susan J
Home Financials for this Owner
Home Financials are based on the most recent Mortgage that was taken out on this home.
Original Mortgage
$46,400
Interest Rate
6.9%
Mortgage Type
New Conventional
Create a Home Valuation Report for This Property
The Home Valuation Report is an in-depth analysis detailing your home's value as well as a comparison with similar homes in the area
Home Values in the Area
Average Home Value in this Area
Purchase History
| Date | Buyer | Sale Price | Title Company |
|---|---|---|---|
| Timul Merline | $195,000 | South Florida Title | |
| Brodskaya Liliya | $140,000 | Attorney | |
| Wolf Sean | -- | Attorney | |
| Wolf Sean | $90,000 | Capital Abstract & Title | |
| Spingarn Susan J | $100 | -- |
Source: Public Records
Mortgage History
| Date | Status | Borrower | Loan Amount |
|---|---|---|---|
| Open | Timul Merline | $199,192 | |
| Previous Owner | Spingarn Susan J | $46,400 |
Source: Public Records
Tax History Compared to Growth
Tax History
| Year | Tax Paid | Tax Assessment Tax Assessment Total Assessment is a certain percentage of the fair market value that is determined by local assessors to be the total taxable value of land and additions on the property. | Land | Improvement |
|---|---|---|---|---|
| 2025 | $4,509 | $230,720 | -- | -- |
| 2024 | $4,048 | $230,720 | $20,150 | $181,330 |
| 2023 | $4,048 | $190,690 | $0 | $0 |
| 2022 | $3,670 | $173,360 | $0 | $0 |
| 2021 | $3,253 | $157,600 | $15,760 | $141,840 |
| 2020 | $3,024 | $146,670 | $14,670 | $132,000 |
| 2019 | $2,837 | $136,490 | $13,650 | $122,840 |
| 2018 | $2,860 | $139,310 | $13,930 | $125,380 |
| 2017 | $2,353 | $110,190 | $0 | $0 |
| 2016 | $2,199 | $100,180 | $0 | $0 |
| 2015 | $2,176 | $91,080 | $0 | $0 |
| 2014 | $1,813 | $82,800 | $0 | $0 |
| 2013 | -- | $65,100 | $6,510 | $58,590 |
Source: Public Records
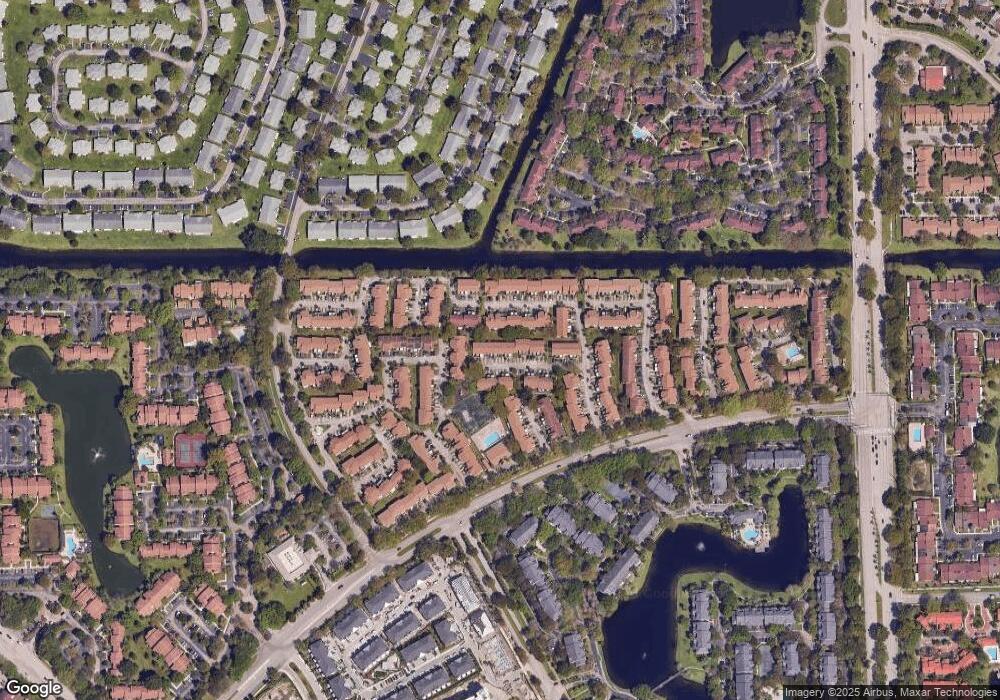
Map
Nearby Homes
- 879 NW 81st Way Unit 4
- 8183 NW 8th Manor Unit 9
- 8203 NW 9th Ct Unit 2
- 841 NW 82nd Ave Unit 2
- 862 NW 81st Terrace Unit 6
- 835 NW 81st Terrace
- 8216 NW 8th St Unit 3
- 8226 NW 8th Place Unit 6
- 8223 NW 8th St Unit 11
- 8248 NW 9th St Unit 6
- 8233 NW 8th Ct
- 8256 NW 9th Ct Unit 2
- 8239 NW 8th St Unit 3
- 865 NW 80th Terrace Unit 6
- 1084 NW 83rd Ave Unit B63
- 8367 NW 7th Place
- 1152 NW 83rd Ave Unit D66
- 8447 NW 12th St Unit A69
- 7940 NW 10th St
- 851 NW 79th Terrace
- 8191 NW 8th Manor Unit 5
- 8187 NW 8th Manor Unit 7
- 8195 NW 8th Manor Unit 3
- 8189 NW 8th Manor Unit 6
- 8189 NW 8th Place Unit 6
- 8199 NW 8th Manor Unit 1
- 885 NW 81st Way
- 885 NW 81st Way Unit 1
- 8185 NW 8th Manor Unit 8
- 8196 NW 8th Manor Unit 2
- 8198 NW 8th Manor Unit 1
- 8192 NW 8th Manor Unit 4
- 8194 NW 8th Manor Unit 318
- 8190 NW 8th Manor Unit 5
- 8190 NW 8th Manor Unit 18-05
- 8200 NW 9th Ct Unit 4
- 873 NW 81st Way Unit 7
- 877 NW 81st Way Unit 5
- 883 NW 81st Way Unit 2
- 8207 NW 8th Place Unit 3