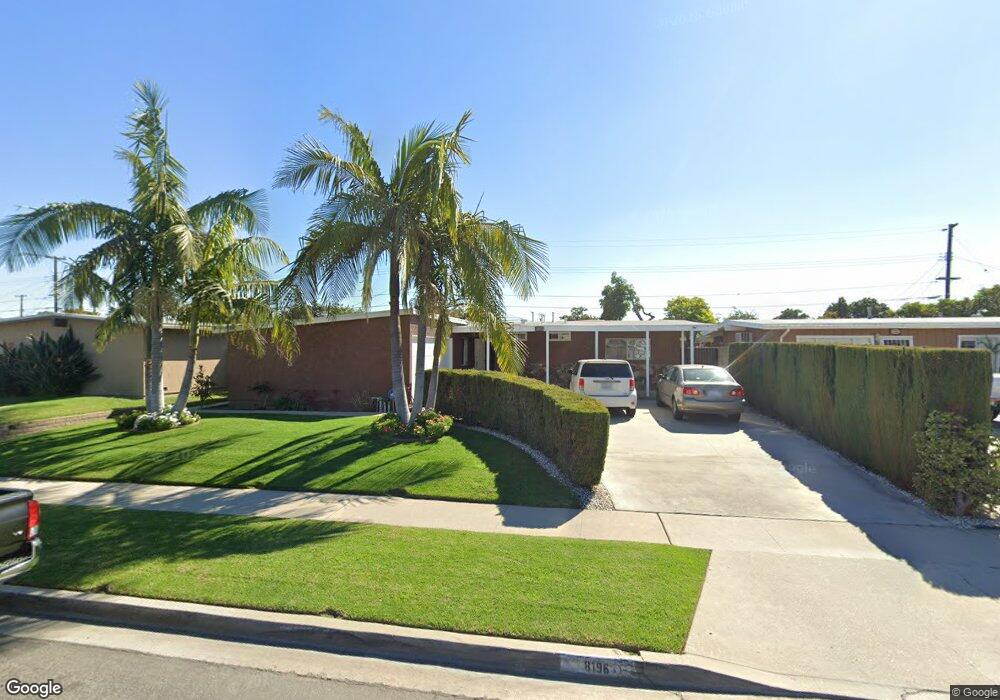
8196 Linden Cir Buena Park, CA 90620
Estimated Value: $869,000 - $892,000
3
Beds
2
Baths
1,613
Sq Ft
$545/Sq Ft
Est. Value
About This Home
This home is located at 8196 Linden Cir, Buena Park, CA 90620 and is currently estimated at $879,474, approximately $545 per square foot. 8196 Linden Cir is a home located in Orange County with nearby schools including Glen H. Dysinger Sr. Elementary School, Dale Jr High School, and Savanna High School.
Ownership History
Date
Name
Owned For
Owner Type
Purchase Details
Closed on
May 29, 2012
Sold by
Gil Adan P and De Anda Maria Luisa
Bought by
Gil Adan P and Gil Maria Luisa
Current Estimated Value
Home Financials for this Owner
Home Financials are based on the most recent Mortgage that was taken out on this home.
Original Mortgage
$153,000
Outstanding Balance
$106,183
Interest Rate
3.86%
Mortgage Type
New Conventional
Estimated Equity
$773,291
Purchase Details
Closed on
Oct 6, 2003
Sold by
Gil Adan P and Deanda Maria Luisa
Bought by
Gil Adan P and Deanda Maria Luisa
Home Financials for this Owner
Home Financials are based on the most recent Mortgage that was taken out on this home.
Original Mortgage
$169,800
Interest Rate
6.27%
Mortgage Type
Purchase Money Mortgage
Purchase Details
Closed on
Oct 20, 1995
Sold by
Mares Ismaela and Rangel Miguel J
Bought by
Gil Adan P and Deanda Maria Luisa
Create a Home Valuation Report for This Property
The Home Valuation Report is an in-depth analysis detailing your home's value as well as a comparison with similar homes in the area
Home Values in the Area
Average Home Value in this Area
Purchase History
| Date | Buyer | Sale Price | Title Company |
|---|---|---|---|
| Gil Adan P | -- | Investors Title Company | |
| Gil Adan P | -- | -- | |
| Gil Adan P | -- | -- |
Source: Public Records
Mortgage History
| Date | Status | Borrower | Loan Amount |
|---|---|---|---|
| Open | Gil Adan P | $153,000 | |
| Closed | Gil Adan P | $169,800 |
Source: Public Records
Tax History Compared to Growth
Tax History
| Year | Tax Paid | Tax Assessment Tax Assessment Total Assessment is a certain percentage of the fair market value that is determined by local assessors to be the total taxable value of land and additions on the property. | Land | Improvement |
|---|---|---|---|---|
| 2025 | $3,778 | $319,227 | $232,320 | $86,907 |
| 2024 | $3,778 | $312,968 | $227,765 | $85,203 |
| 2023 | $3,683 | $306,832 | $223,299 | $83,533 |
| 2022 | $3,633 | $300,816 | $218,920 | $81,896 |
| 2021 | $3,581 | $294,918 | $214,627 | $80,291 |
| 2020 | $3,559 | $291,894 | $212,426 | $79,468 |
| 2019 | $3,471 | $286,171 | $208,261 | $77,910 |
| 2018 | $3,408 | $280,560 | $204,177 | $76,383 |
| 2017 | $3,302 | $275,059 | $200,173 | $74,886 |
| 2016 | $3,239 | $269,666 | $196,248 | $73,418 |
| 2015 | $3,202 | $265,616 | $193,300 | $72,316 |
| 2014 | $3,043 | $260,413 | $189,513 | $70,900 |
Source: Public Records
Map
Nearby Homes
- 8452 Stanton Ave
- 8319 Hickory Dr
- 8073 Cactus Cir
- 7950 Jackson Way
- 2871 W Tyler Ave
- 400 N Syracuse St
- 2943 W Lincoln Ave
- 8434 Periwinkle Dr
- 8054 Teakwood Cir
- 605 N La Reina St
- Plan Seven at Mason
- Plan Three at Mason
- Plan Four at Mason
- Plan Two at Mason
- 109 S Laxore St
- 21 Centerstone Cir
- 103 S Laxore St
- 107 S Laxore St
- 106 S Laxore St Unit 407
- 7545 Jackson Way
- 8184 Linden Cir
- 8208 Linden Cir
- 8197 Lemon Cir
- 8220 Linden Cir
- 8185 Lemon Cir Unit 1
- 8185 Lemon Cir
- 8209 Lemon Cir
- 8372 Locust Dr
- 8197 Linden Cir
- 8221 Lemon Cir
- 8173 Lemon Cir
- 8185 Linden Cir
- 8209 Linden Cir
- 8232 Linden Cir
- 8221 Linden Cir
- 8173 Linden Cir
- 8233 Lemon Cir
- 8233 Linden Cir
- 8196 Larch Cir
- 8196 Lemon Cir