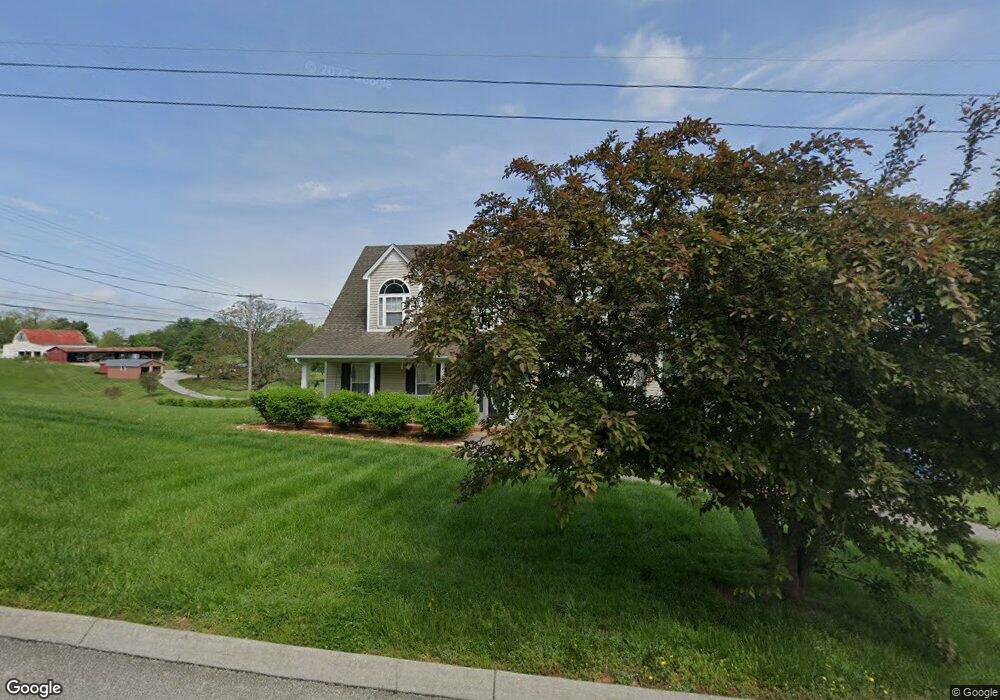
8198 W Pointe Dr Talbott, TN 37877
Estimated Value: $337,000 - $428,000
3
Beds
3
Baths
2,066
Sq Ft
$186/Sq Ft
Est. Value
About This Home
This home is located at 8198 W Pointe Dr, Talbott, TN 37877 and is currently estimated at $384,735, approximately $186 per square foot. 8198 W Pointe Dr is a home located in Hamblen County with nearby schools including Alpha Elementary School, West View Middle School, and Morristown West High School.
Ownership History
Date
Name
Owned For
Owner Type
Purchase Details
Closed on
May 23, 2011
Sold by
Pressley Neil E
Bought by
Williams Melvin L and Williams Melissa D
Current Estimated Value
Home Financials for this Owner
Home Financials are based on the most recent Mortgage that was taken out on this home.
Original Mortgage
$145,800
Outstanding Balance
$94,486
Interest Rate
3.62%
Mortgage Type
FHA
Estimated Equity
$290,249
Purchase Details
Closed on
Oct 16, 2001
Sold by
Randy Rogers
Bought by
Pressley Neil
Home Financials for this Owner
Home Financials are based on the most recent Mortgage that was taken out on this home.
Original Mortgage
$141,800
Interest Rate
6.85%
Purchase Details
Closed on
May 1, 2001
Sold by
Rogers U M
Bought by
Dobrose Christopher
Purchase Details
Closed on
Oct 14, 1949
Bought by
Mcmurray James G and Mcmurray Martha H
Create a Home Valuation Report for This Property
The Home Valuation Report is an in-depth analysis detailing your home's value as well as a comparison with similar homes in the area
Purchase History
| Date | Buyer | Sale Price | Title Company |
|---|---|---|---|
| Williams Melvin L | $152,000 | -- | |
| Pressley Neil | $149,300 | -- | |
| Dobrose Christopher | $139,000 | -- | |
| Mcmurray James G | -- | -- |
Source: Public Records
Mortgage History
| Date | Status | Borrower | Loan Amount |
|---|---|---|---|
| Open | Williams Melvin L | $145,800 | |
| Previous Owner | Mcmurray James G | $141,800 |
Source: Public Records
Tax History
| Year | Tax Paid | Tax Assessment Tax Assessment Total Assessment is a certain percentage of the fair market value that is determined by local assessors to be the total taxable value of land and additions on the property. | Land | Improvement |
|---|---|---|---|---|
| 2025 | $1,212 | $82,475 | $7,475 | $75,000 |
| 2024 | $928 | $47,125 | $5,975 | $41,150 |
| 2023 | $928 | $47,125 | $0 | $0 |
| 2022 | $915 | $46,425 | $5,975 | $40,450 |
| 2021 | $915 | $46,425 | $5,975 | $40,450 |
| 2020 | $915 | $46,425 | $5,975 | $40,450 |
| 2019 | $922 | $43,300 | $7,775 | $35,525 |
| 2018 | $922 | $43,300 | $7,775 | $35,525 |
| 2017 | $922 | $43,300 | $7,775 | $35,525 |
| 2016 | $862 | $43,300 | $7,775 | $35,525 |
| 2015 | $801 | $43,300 | $7,775 | $35,525 |
| 2014 | -- | $43,300 | $7,775 | $35,525 |
| 2013 | -- | $47,350 | $0 | $0 |
Source: Public Records
Map
Nearby Homes
- Lot 135 W Point Dr
- 8070 W Pointe Dr
- 1437 Beacon Rd
- 634 Heather Brook Cir
- tbd Lebanon Church Rd
- 120 Waverly Path
- 487 Heather Brook Dr
- 2320 Beacon Rd
- 7713 Melanie Cir
- 2559 Dogwood Ln
- 1171 W E Hwy 11e E
- 595 Ricky Dr
- 510 E Old Andrew Johnson Hwy
- 413 English Dr
- 2232 Center Cir
- 104 Claire Place
- 158 Claire Place
- 1205 Cole
- 1209 Cole Dr
- 0 Boxwood Ln
- 8184 W Pointe Dr
- 8189 W Pointe Dr
- 1250 Tarr Rd
- 8177 W Pointe Dr
- 8176 W Pointe Dr
- 1200 Tarr Rd
- 8097 Hulls Mill Rd
- 8080 S Pointe Dr
- 8169 W Pointe Dr
- 8170 W Pointe Dr
- 1300 Tarr Rd
- 8060 S Pointe Dr
- 1181 Tarr Rd
- 0 Hulls Mill Rd
- 8161 W Pointe Dr
- 8164 W Pointe Dr
- 1176 Tarr Rd
- 8040 S Pointe Dr
- 8063 S Pointe Dr
- 8155 W Pointe Dr
Your Personal Tour Guide
Ask me questions while you tour the home.