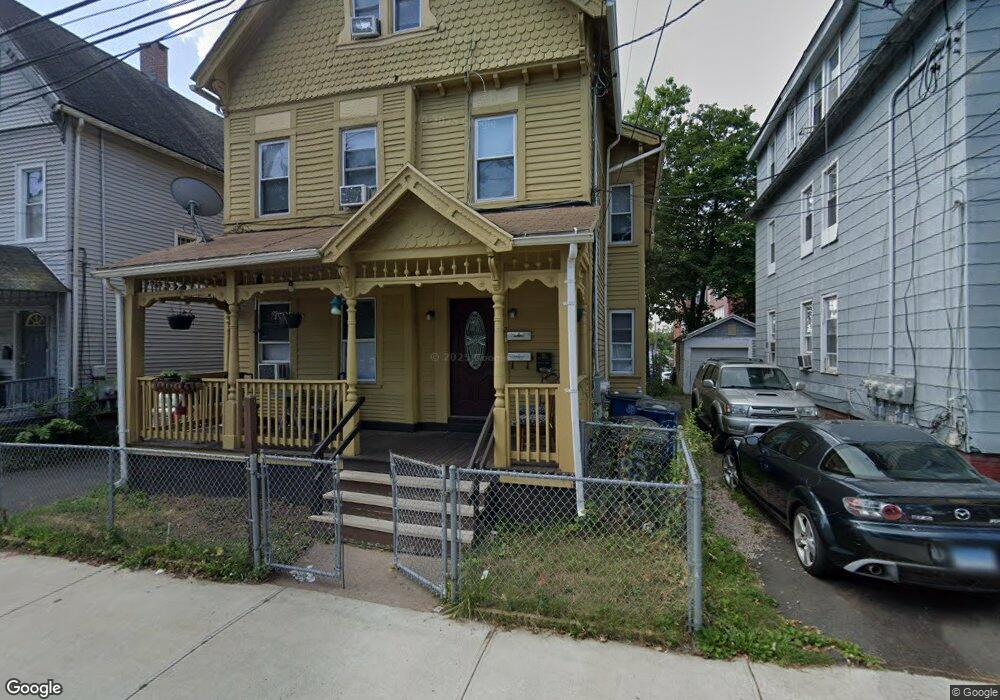
82 Bright St New Haven, CT 06513
Fair Haven NeighborhoodEstimated Value: $308,565 - $363,000
3
Beds
2
Baths
2,400
Sq Ft
$139/Sq Ft
Est. Value
About This Home
This home is located at 82 Bright St, New Haven, CT 06513 and is currently estimated at $334,141, approximately $139 per square foot. 82 Bright St is a home located in New Haven County with nearby schools including Clinton Avenue School, St Francis & St Rose Of Lima School, and Cold Spring School.
Ownership History
Date
Name
Owned For
Owner Type
Purchase Details
Closed on
Dec 28, 2017
Sold by
Parise Joy
Bought by
Parise Frank M
Current Estimated Value
Purchase Details
Closed on
May 21, 2010
Sold by
Fhlmc
Bought by
Parise Joy
Purchase Details
Closed on
Mar 2, 2010
Sold by
Jp Morgan Chase Bk
Bought by
Fhlmc
Purchase Details
Closed on
Feb 16, 2010
Sold by
Vargas Evelyn
Bought by
Jp Morgan Chase Bk
Purchase Details
Closed on
May 22, 2006
Sold by
Santiago Angel
Bought by
Vargas Evelyn and Vargas Jaime
Home Financials for this Owner
Home Financials are based on the most recent Mortgage that was taken out on this home.
Original Mortgage
$225,000
Interest Rate
6.42%
Purchase Details
Closed on
Mar 24, 1997
Sold by
Emc Mortgage Corp
Bought by
Muniz Arturo and Hall John
Purchase Details
Closed on
Feb 23, 1996
Sold by
Great Western Bk
Bought by
Emc Mortgage Corp
Purchase Details
Closed on
Dec 6, 1990
Sold by
Bove Jennie M
Bought by
Buccini Louis
Create a Home Valuation Report for This Property
The Home Valuation Report is an in-depth analysis detailing your home's value as well as a comparison with similar homes in the area
Home Values in the Area
Average Home Value in this Area
Purchase History
| Date | Buyer | Sale Price | Title Company |
|---|---|---|---|
| Parise Frank M | -- | -- | |
| Parise Joy | $50,650 | -- | |
| Fhlmc | -- | -- | |
| Jp Morgan Chase Bk | -- | -- | |
| Vargas Evelyn | $250,000 | -- | |
| Muniz Arturo | $15,450 | -- | |
| Emc Mortgage Corp | $30,922 | -- | |
| Buccini Louis | $30,000 | -- |
Source: Public Records
Mortgage History
| Date | Status | Borrower | Loan Amount |
|---|---|---|---|
| Previous Owner | Buccini Louis | $225,000 | |
| Previous Owner | Buccini Louis | $12,500 |
Source: Public Records
Tax History Compared to Growth
Tax History
| Year | Tax Paid | Tax Assessment Tax Assessment Total Assessment is a certain percentage of the fair market value that is determined by local assessors to be the total taxable value of land and additions on the property. | Land | Improvement |
|---|---|---|---|---|
| 2025 | $5,599 | $142,100 | $26,040 | $116,060 |
| 2024 | $5,471 | $142,100 | $26,040 | $116,060 |
| 2023 | $5,286 | $142,100 | $26,040 | $116,060 |
| 2022 | $5,648 | $142,100 | $26,040 | $116,060 |
| 2021 | $3,185 | $72,590 | $20,790 | $51,800 |
| 2020 | $3,185 | $72,590 | $20,790 | $51,800 |
| 2019 | $3,120 | $72,590 | $20,790 | $51,800 |
| 2018 | $3,120 | $72,590 | $20,790 | $51,800 |
| 2017 | $2,808 | $72,590 | $20,790 | $51,800 |
| 2016 | $2,373 | $57,120 | $13,860 | $43,260 |
| 2015 | $2,373 | $57,120 | $13,860 | $43,260 |
| 2014 | $2,373 | $57,120 | $13,860 | $43,260 |
Source: Public Records
Map
Nearby Homes