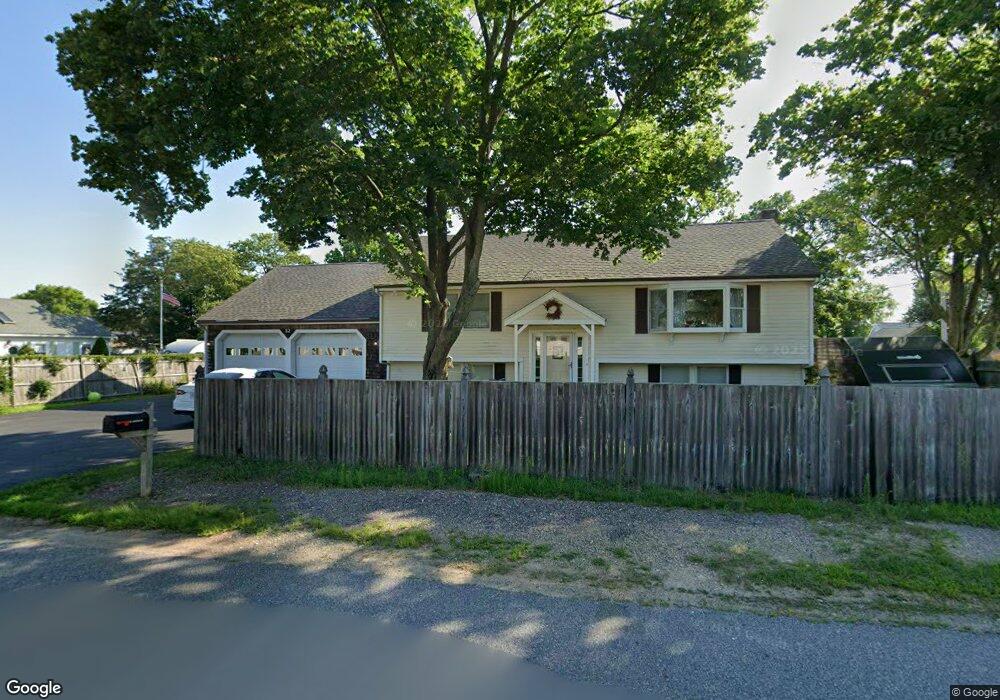
82 Bryant St Marshfield, MA 02050
Ocean Bluff-Brant Rock NeighborhoodEstimated Value: $706,000 - $830,000
2
Beds
3
Baths
1,508
Sq Ft
$509/Sq Ft
Est. Value
About This Home
This home is located at 82 Bryant St, Marshfield, MA 02050 and is currently estimated at $767,910, approximately $509 per square foot. 82 Bryant St is a home located in Plymouth County with nearby schools including Governor Edward Winslow School, Furnace Brook Middle School, and Marshfield High School.
Ownership History
Date
Name
Owned For
Owner Type
Purchase Details
Closed on
Apr 13, 2018
Sold by
Mcgonagle Sean W and Decoste Sheila M
Bought by
Decoste Sheila M
Current Estimated Value
Home Financials for this Owner
Home Financials are based on the most recent Mortgage that was taken out on this home.
Original Mortgage
$326,000
Outstanding Balance
$277,862
Interest Rate
4.43%
Mortgage Type
New Conventional
Estimated Equity
$490,048
Purchase Details
Closed on
Jan 20, 2015
Sold by
Decoste Ret and Decoste
Bought by
Mcgonagle Sean W and Decoste Sheila M
Home Financials for this Owner
Home Financials are based on the most recent Mortgage that was taken out on this home.
Original Mortgage
$247,500
Interest Rate
3.92%
Mortgage Type
New Conventional
Create a Home Valuation Report for This Property
The Home Valuation Report is an in-depth analysis detailing your home's value as well as a comparison with similar homes in the area
Home Values in the Area
Average Home Value in this Area
Purchase History
| Date | Buyer | Sale Price | Title Company |
|---|---|---|---|
| Decoste Sheila M | -- | -- | |
| Mcgonagle Sean W | $330,000 | -- |
Source: Public Records
Mortgage History
| Date | Status | Borrower | Loan Amount |
|---|---|---|---|
| Open | Decoste Sheila M | $326,000 | |
| Previous Owner | Mcgonagle Sean W | $247,500 |
Source: Public Records
Tax History
| Year | Tax Paid | Tax Assessment Tax Assessment Total Assessment is a certain percentage of the fair market value that is determined by local assessors to be the total taxable value of land and additions on the property. | Land | Improvement |
|---|---|---|---|---|
| 2025 | $6,839 | $690,800 | $321,600 | $369,200 |
| 2024 | $6,563 | $631,700 | $301,500 | $330,200 |
| 2023 | $6,079 | $559,200 | $271,300 | $287,900 |
| 2022 | $6,079 | $469,400 | $231,100 | $238,300 |
| 2021 | $5,851 | $443,600 | $221,100 | $222,500 |
| 2020 | $5,457 | $409,400 | $190,900 | $218,500 |
| 2019 | $5,345 | $399,500 | $190,900 | $208,600 |
| 2018 | $5,208 | $389,500 | $190,900 | $198,600 |
| 2017 | $4,957 | $361,300 | $180,900 | $180,400 |
| 2016 | $4,898 | $352,900 | $170,800 | $182,100 |
| 2015 | $4,597 | $345,900 | $170,800 | $175,100 |
| 2014 | $4,337 | $326,300 | $170,800 | $155,500 |
Source: Public Records
Map
Nearby Homes
Your Personal Tour Guide
Ask me questions while you tour the home.