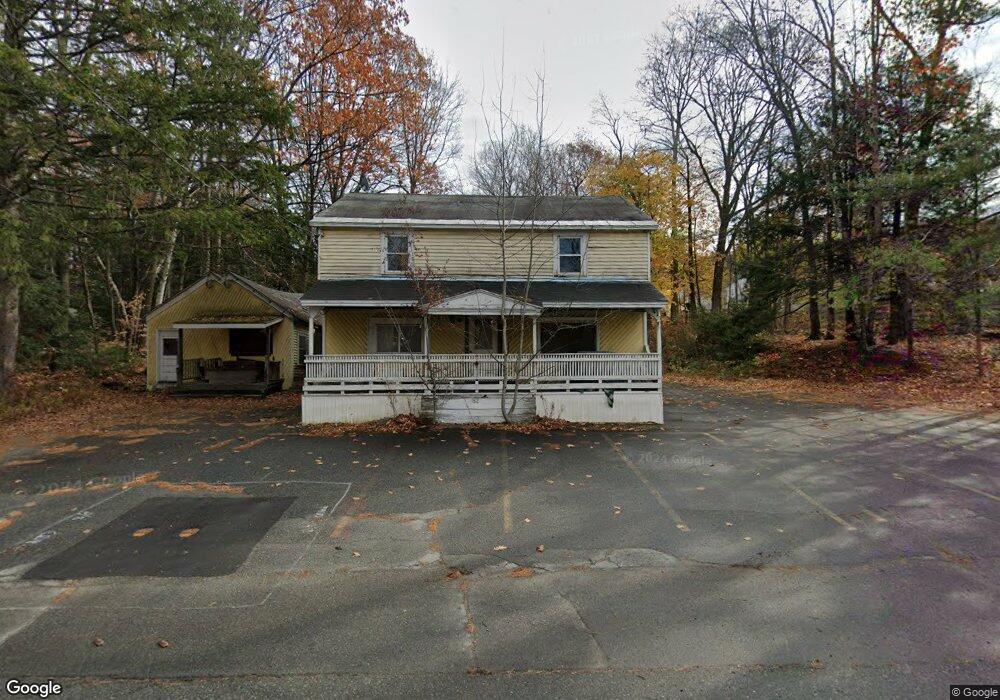
82 Charlestown Rd Claremont, NH 03743
South End NeighborhoodEstimated Value: $300,000 - $403,000
3
Beds
2
Baths
2,240
Sq Ft
$157/Sq Ft
Est. Value
About This Home
This home is located at 82 Charlestown Rd, Claremont, NH 03743 and is currently estimated at $350,782, approximately $156 per square foot. 82 Charlestown Rd is a home located in Sullivan County with nearby schools including Maple Avenue School, Claremont Middle School, and Stevens High School.
Ownership History
Date
Name
Owned For
Owner Type
Purchase Details
Closed on
Dec 7, 2007
Sold by
Ross Stephen
Bought by
Hentschel Lee C and Hentschel Teena
Current Estimated Value
Purchase Details
Closed on
May 3, 2001
Sold by
Mileti Michael J
Bought by
Sugar River Svgs
Purchase Details
Closed on
Oct 5, 1999
Sold by
Laplante Es Ralph J
Bought by
Militi Michael J
Home Financials for this Owner
Home Financials are based on the most recent Mortgage that was taken out on this home.
Original Mortgage
$136,800
Interest Rate
7.85%
Create a Home Valuation Report for This Property
The Home Valuation Report is an in-depth analysis detailing your home's value as well as a comparison with similar homes in the area
Home Values in the Area
Average Home Value in this Area
Purchase History
| Date | Buyer | Sale Price | Title Company |
|---|---|---|---|
| Hentschel Lee C | $98,700 | -- | |
| Sugar River Svgs | $110,000 | -- | |
| Militi Michael J | $140,000 | -- |
Source: Public Records
Mortgage History
| Date | Status | Borrower | Loan Amount |
|---|---|---|---|
| Open | Militi Michael J | $60,000 | |
| Closed | Militi Michael J | $50,000 | |
| Previous Owner | Militi Michael J | $136,800 |
Source: Public Records
Tax History Compared to Growth
Tax History
| Year | Tax Paid | Tax Assessment Tax Assessment Total Assessment is a certain percentage of the fair market value that is determined by local assessors to be the total taxable value of land and additions on the property. | Land | Improvement |
|---|---|---|---|---|
| 2024 | $6,335 | $216,500 | $26,700 | $189,800 |
| 2023 | $6,019 | $216,500 | $26,700 | $189,800 |
| 2022 | $5,423 | $130,100 | $17,200 | $112,900 |
| 2021 | $5,331 | $130,100 | $17,200 | $112,900 |
| 2020 | $5,298 | $130,100 | $17,200 | $112,900 |
| 2019 | $5,238 | $130,100 | $17,200 | $112,900 |
| 2018 | $4,604 | $109,400 | $17,200 | $92,200 |
| 2017 | $4,667 | $109,400 | $17,200 | $92,200 |
| 2016 | $4,663 | $109,400 | $17,200 | $92,200 |
| 2015 | $4,537 | $109,400 | $17,200 | $92,200 |
| 2014 | $4,522 | $109,400 | $17,200 | $92,200 |
| 2013 | $4,720 | $130,200 | $43,700 | $86,500 |
Source: Public Records
Map
Nearby Homes