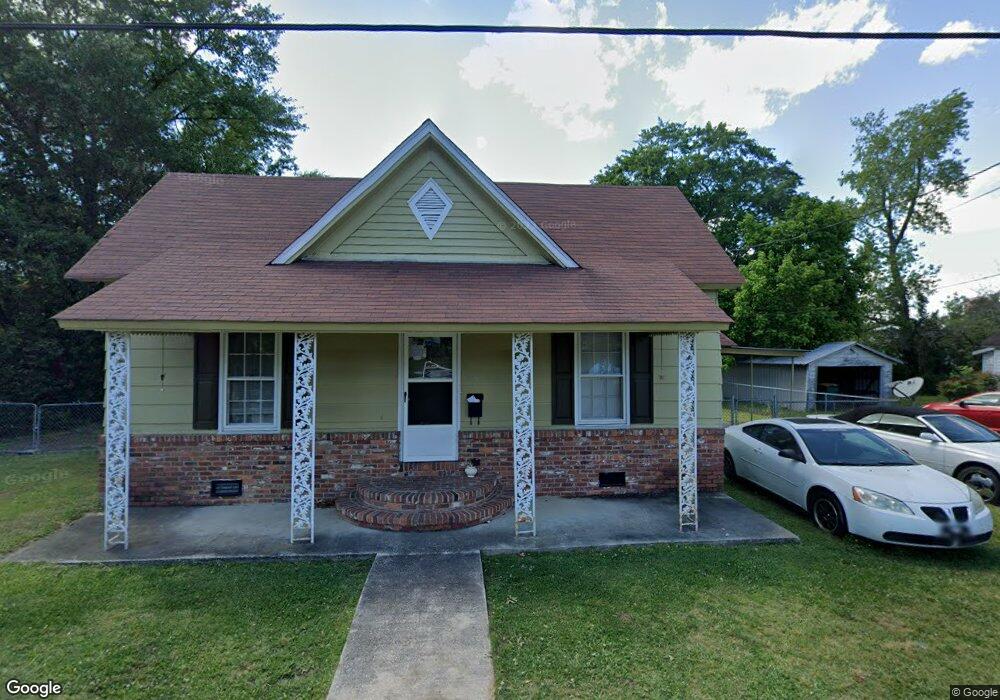
82 Delmar St Lumberton, NC 28358
Estimated Value: $67,000 - $113,000
1
Bed
1
Bath
1,208
Sq Ft
$68/Sq Ft
Est. Value
About This Home
This home is located at 82 Delmar St, Lumberton, NC 28358 and is currently estimated at $81,784, approximately $67 per square foot. 82 Delmar St is a home located in Robeson County with nearby schools including Tanglewood Elementary School, Parkton Elementary School, and L. Gilbert Carroll Middle School.
Ownership History
Date
Name
Owned For
Owner Type
Purchase Details
Closed on
Jan 1, 2003
Sold by
Locklear Curt and Wf Loc
Bought by
Locklear Family Investments L
Current Estimated Value
Purchase Details
Closed on
Jan 1, 2002
Sold by
Locklear Curt and Locklear Lockle
Bought by
Locklear Family Investments L
Purchase Details
Closed on
Jan 1, 2000
Sold by
Locklear Curt and Locklear Lockle
Bought by
Locklear Family Investments L
Purchase Details
Closed on
Jan 1, 1987
Sold by
Locklear Curt and Wf Jan
Bought by
Locklear Family Investments L
Create a Home Valuation Report for This Property
The Home Valuation Report is an in-depth analysis detailing your home's value as well as a comparison with similar homes in the area
Home Values in the Area
Average Home Value in this Area
Purchase History
| Date | Buyer | Sale Price | Title Company |
|---|---|---|---|
| Locklear Family Investments L | -- | -- | |
| Locklear Family Investments L | -- | -- | |
| Locklear Family Investments L | -- | -- | |
| Locklear Family Investments L | -- | -- |
Source: Public Records
Tax History Compared to Growth
Tax History
| Year | Tax Paid | Tax Assessment Tax Assessment Total Assessment is a certain percentage of the fair market value that is determined by local assessors to be the total taxable value of land and additions on the property. | Land | Improvement |
|---|---|---|---|---|
| 2025 | $516 | $58,100 | $5,500 | $52,600 |
| 2024 | $511 | $58,100 | $5,500 | $52,600 |
| 2023 | $380 | $40,600 | $5,000 | $35,600 |
| 2022 | $380 | $40,600 | $5,000 | $35,600 |
| 2021 | $380 | $40,600 | $5,000 | $35,600 |
| 2020 | $365 | $40,600 | $5,000 | $35,600 |
| 2018 | $373 | $29,600 | $5,000 | $24,600 |
| 2017 | $288 | $29,600 | $5,000 | $24,600 |
| 2016 | $288 | $29,600 | $5,000 | $24,600 |
| 2015 | $288 | $29,600 | $5,000 | $24,600 |
| 2014 | $288 | $29,600 | $5,000 | $24,600 |
Source: Public Records
Map
Nearby Homes