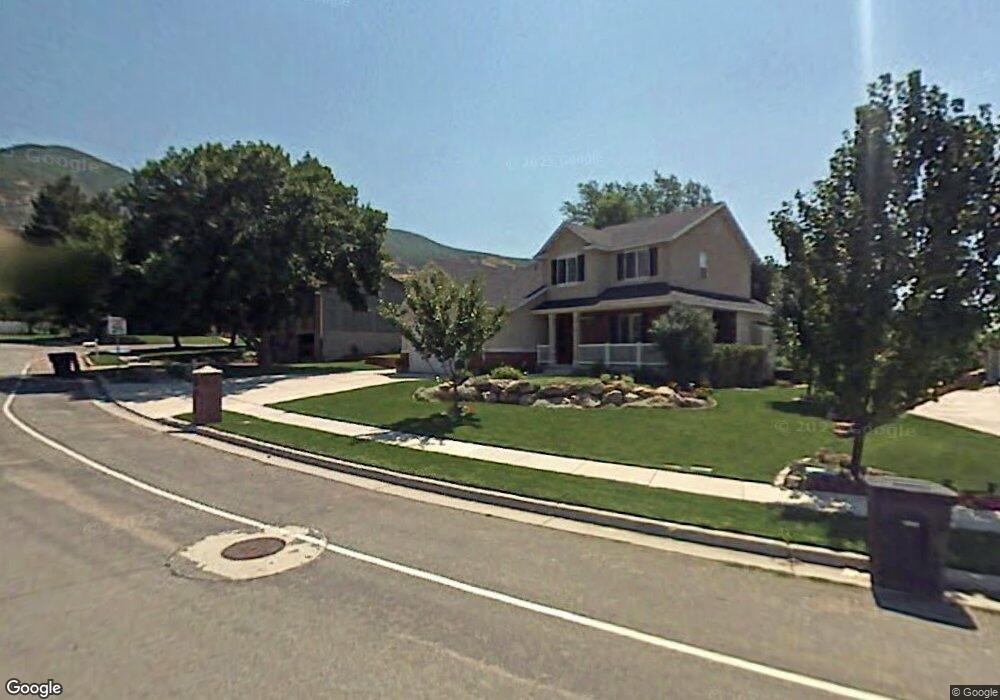
82 E Continental Dr Unit 6 Farmington, UT 84025
Estimated Value: $698,000 - $763,000
5
Beds
4
Baths
1,930
Sq Ft
$377/Sq Ft
Est. Value
About This Home
This home is located at 82 E Continental Dr Unit 6, Farmington, UT 84025 and is currently estimated at $727,165, approximately $376 per square foot. 82 E Continental Dr Unit 6 is a home located in Davis County with nearby schools including Farmington Elementary School, Farmington High, and Farmington Junior High School.
Ownership History
Date
Name
Owned For
Owner Type
Purchase Details
Closed on
Jan 6, 2023
Sold by
Larsen Gregory
Bought by
Gregory And Megan Larsen Living Trust
Current Estimated Value
Purchase Details
Closed on
Dec 1, 2017
Sold by
Farr Douglas B and Farr N
Bought by
Larsen Gregory and Larsen Megan
Purchase Details
Closed on
Dec 13, 2001
Sold by
Symphony Development Corp
Bought by
Farr Douglas B and Farr N
Home Financials for this Owner
Home Financials are based on the most recent Mortgage that was taken out on this home.
Original Mortgage
$196,650
Interest Rate
6.57%
Create a Home Valuation Report for This Property
The Home Valuation Report is an in-depth analysis detailing your home's value as well as a comparison with similar homes in the area
Home Values in the Area
Average Home Value in this Area
Purchase History
| Date | Buyer | Sale Price | Title Company |
|---|---|---|---|
| Gregory And Megan Larsen Living Trust | -- | -- | |
| Gregory And Megan Larsen Living Trust | -- | None Listed On Document | |
| Larsen Gregory | -- | Old Republic Title | |
| Farr Douglas B | -- | Bonneville Title Company Inc |
Source: Public Records
Mortgage History
| Date | Status | Borrower | Loan Amount |
|---|---|---|---|
| Previous Owner | Farr Douglas B | $196,650 |
Source: Public Records
Tax History Compared to Growth
Tax History
| Year | Tax Paid | Tax Assessment Tax Assessment Total Assessment is a certain percentage of the fair market value that is determined by local assessors to be the total taxable value of land and additions on the property. | Land | Improvement |
|---|---|---|---|---|
| 2025 | $3,559 | $352,550 | $160,609 | $191,941 |
| 2024 | $3,559 | $355,850 | $156,452 | $199,398 |
| 2023 | $3,282 | $598,000 | $233,441 | $364,559 |
| 2022 | $3,301 | $341,550 | $116,264 | $225,286 |
| 2021 | $2,941 | $453,000 | $183,429 | $269,571 |
| 2020 | $2,830 | $425,000 | $157,967 | $267,033 |
| 2019 | $2,876 | $419,000 | $156,576 | $262,424 |
| 2018 | $2,759 | $396,000 | $149,389 | $246,611 |
| 2016 | $2,390 | $176,605 | $62,524 | $114,081 |
| 2015 | $2,395 | $167,915 | $62,524 | $105,391 |
| 2014 | $2,504 | $180,442 | $52,104 | $128,338 |
| 2013 | -- | $170,802 | $51,571 | $119,231 |
Source: Public Records
Map
Nearby Homes
- 774 Eliza Ct
- 247 Paulette Way
- 434 W 450 S Unit 815
- 1603 S 200 E
- 1597 S 200 E
- 250 S 200 W
- 877 S 200 E
- 903 S 200 E
- 431 E Greystone Dr
- 432 E Greystone Dr Unit 308
- 442 W Randys Ct Unit 808
- 514 Rigby Rd
- 334 E Cottrell Ln
- 79 S 300 E
- 13 Sunset Dr
- 554 W Cottle Ln
- 21 N 100 W Unit 3
- 38 S 300 W
- 626 W Cottle Ln
- 372 W Clark Cir
- 82 W 620 S
- 82 E 620 S
- 92 E 550 S
- 68 E 620 S
- 95 E Continental Dr S Unit 61-G
- 626 S 100 E
- 77 W 620 S
- 77 E Continental Dr
- 77 E Continental Dr Unit 7
- 77 E 620 S
- 642 S 100 E
- 54 E Continental Dr
- 54 E Continental Dr Unit 4
- 54 E 620 S
- 599 Glynhill Ct
- 95 W 620 S
- 95 E Continental Dr
- 54 W 620 S
- 609 S 100 E
- 621 S 100 E