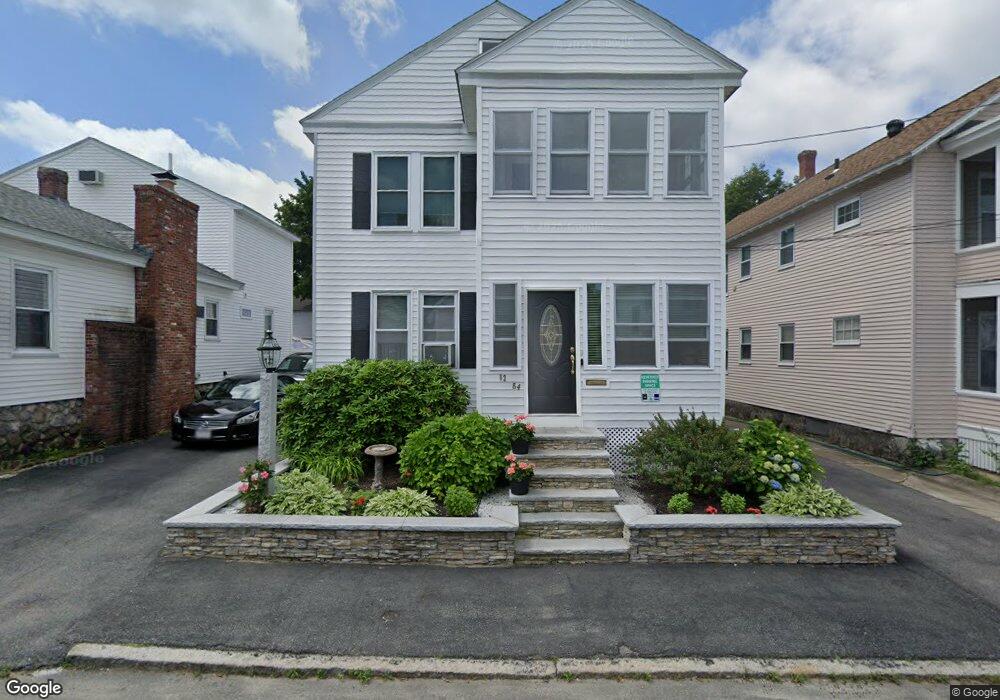
82 Endicott St Lowell, MA 01854
Pawtucketville NeighborhoodEstimated Value: $546,000 - $693,000
4
Beds
2
Baths
2,300
Sq Ft
$271/Sq Ft
Est. Value
About This Home
This home is located at 82 Endicott St, Lowell, MA 01854 and is currently estimated at $622,487, approximately $270 per square foot. 82 Endicott St is a home located in Middlesex County with nearby schools including Joseph McAvinnue Elementary School, Charlotte M. Murkland Elementary School, and Charles W. Morey Elementary School.
Ownership History
Date
Name
Owned For
Owner Type
Purchase Details
Closed on
Feb 15, 2013
Sold by
Gamache Paul G and Gamache Rachel I
Bought by
Bowden Paula M and Bowden Allyson D
Current Estimated Value
Create a Home Valuation Report for This Property
The Home Valuation Report is an in-depth analysis detailing your home's value as well as a comparison with similar homes in the area
Home Values in the Area
Average Home Value in this Area
Purchase History
| Date | Buyer | Sale Price | Title Company |
|---|---|---|---|
| Bowden Paula M | -- | -- | |
| Bowden Paula M | -- | -- |
Source: Public Records
Mortgage History
| Date | Status | Borrower | Loan Amount |
|---|---|---|---|
| Previous Owner | Bowden Paula M | $70,000 | |
| Previous Owner | Bowden Paula M | $45,000 |
Source: Public Records
Tax History Compared to Growth
Tax History
| Year | Tax Paid | Tax Assessment Tax Assessment Total Assessment is a certain percentage of the fair market value that is determined by local assessors to be the total taxable value of land and additions on the property. | Land | Improvement |
|---|---|---|---|---|
| 2025 | $6,309 | $549,600 | $124,600 | $425,000 |
| 2024 | $5,673 | $476,300 | $100,500 | $375,800 |
| 2023 | $5,214 | $419,800 | $82,100 | $337,700 |
| 2022 | $4,686 | $369,300 | $72,700 | $296,600 |
| 2021 | $4,346 | $322,900 | $63,200 | $259,700 |
| 2020 | $4,291 | $321,200 | $81,800 | $239,400 |
| 2019 | $3,982 | $283,600 | $71,800 | $211,800 |
| 2018 | $3,713 | $258,000 | $68,400 | $189,600 |
| 2017 | $3,509 | $235,200 | $62,200 | $173,000 |
| 2016 | $3,540 | $233,500 | $60,500 | $173,000 |
| 2015 | $3,231 | $208,700 | $57,900 | $150,800 |
| 2013 | $2,867 | $191,000 | $63,900 | $127,100 |
Source: Public Records
Map
Nearby Homes