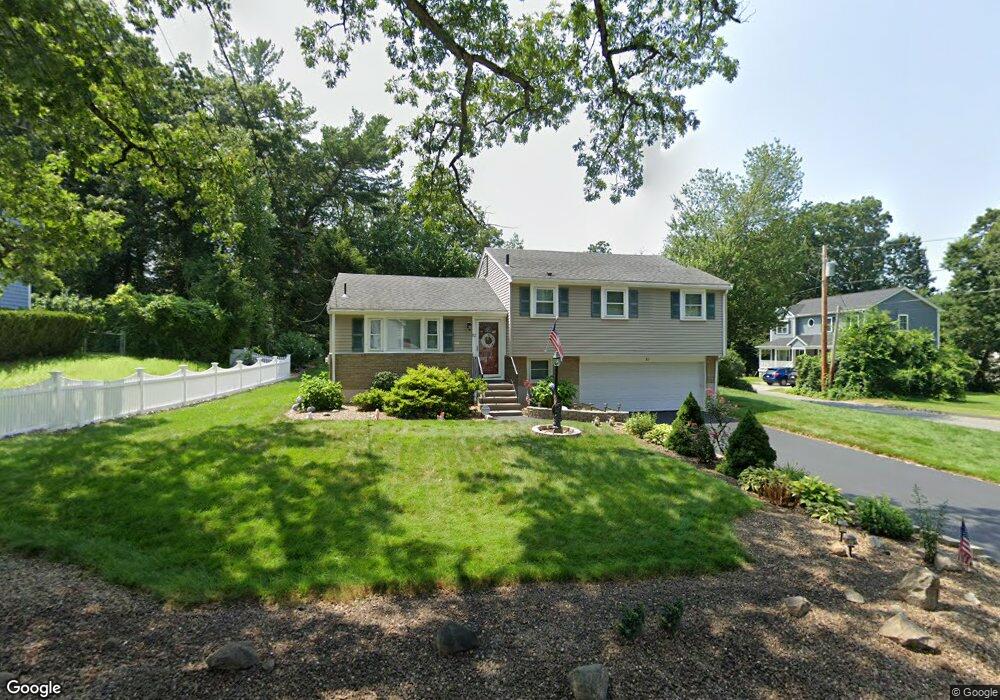
82 Glen Rd Wilmington, MA 01887
Estimated Value: $725,897 - $816,000
3
Beds
2
Baths
1,650
Sq Ft
$466/Sq Ft
Est. Value
About This Home
This home is located at 82 Glen Rd, Wilmington, MA 01887 and is currently estimated at $768,224, approximately $465 per square foot. 82 Glen Rd is a home located in Middlesex County with nearby schools including Wilmington Middle School, Wilmington High School, and Austin Preparatory School.
Ownership History
Date
Name
Owned For
Owner Type
Purchase Details
Closed on
Mar 23, 2007
Sold by
Robbins Wayne E
Bought by
Armoian Mark and Armoian Susan
Current Estimated Value
Purchase Details
Closed on
Jul 6, 2005
Sold by
Bridge Florence P and Sennett Florence P
Bought by
Robbins Wayne E
Home Financials for this Owner
Home Financials are based on the most recent Mortgage that was taken out on this home.
Original Mortgage
$292,500
Interest Rate
5.71%
Mortgage Type
Purchase Money Mortgage
Create a Home Valuation Report for This Property
The Home Valuation Report is an in-depth analysis detailing your home's value as well as a comparison with similar homes in the area
Home Values in the Area
Average Home Value in this Area
Purchase History
| Date | Buyer | Sale Price | Title Company |
|---|---|---|---|
| Armoian Mark | $394,000 | -- | |
| Robbins Wayne E | $325,000 | -- |
Source: Public Records
Mortgage History
| Date | Status | Borrower | Loan Amount |
|---|---|---|---|
| Previous Owner | Robbins Wayne E | $292,500 |
Source: Public Records
Tax History Compared to Growth
Tax History
| Year | Tax Paid | Tax Assessment Tax Assessment Total Assessment is a certain percentage of the fair market value that is determined by local assessors to be the total taxable value of land and additions on the property. | Land | Improvement |
|---|---|---|---|---|
| 2025 | $7,074 | $617,800 | $275,400 | $342,400 |
| 2024 | $6,882 | $602,100 | $275,400 | $326,700 |
| 2023 | $6,617 | $554,200 | $250,400 | $303,800 |
| 2022 | $6,356 | $487,800 | $208,600 | $279,200 |
| 2021 | $6,506 | $470,100 | $189,600 | $280,500 |
| 2020 | $6,133 | $451,600 | $189,600 | $262,000 |
| 2019 | $5,517 | $401,200 | $180,500 | $220,700 |
| 2018 | $5,512 | $382,500 | $172,000 | $210,500 |
| 2017 | $5,471 | $378,600 | $168,100 | $210,500 |
| 2016 | $5,330 | $364,300 | $160,100 | $204,200 |
| 2015 | $4,920 | $342,400 | $160,100 | $182,300 |
| 2014 | $4,545 | $319,200 | $152,500 | $166,700 |
Source: Public Records
Map
Nearby Homes