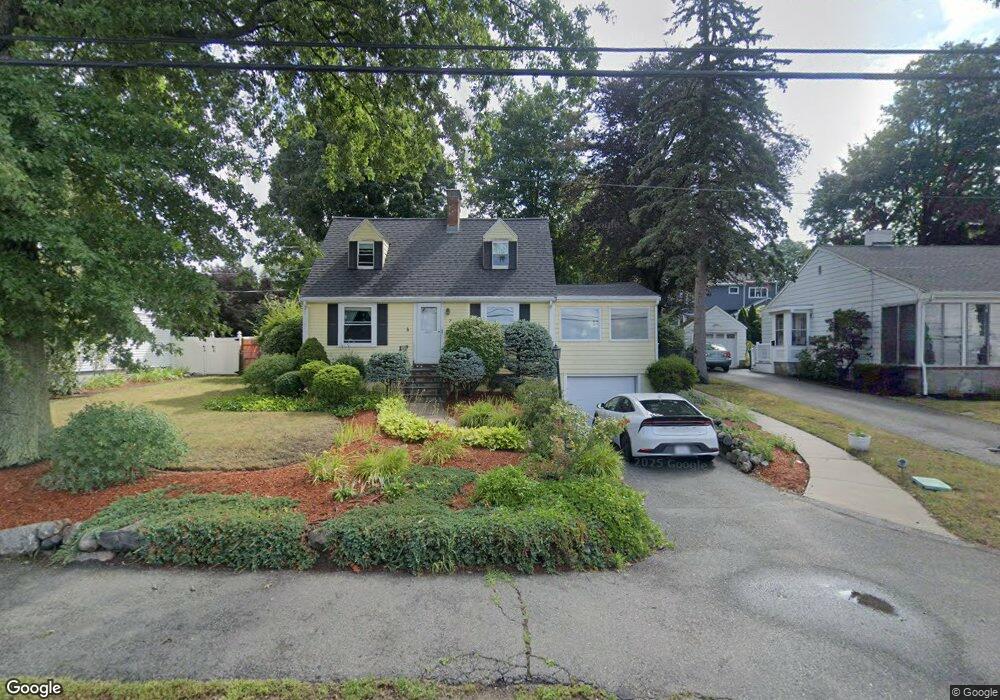
82 Main St Wakefield, MA 01880
Lakeside NeighborhoodEstimated Value: $806,000 - $878,000
3
Beds
2
Baths
1,798
Sq Ft
$467/Sq Ft
Est. Value
About This Home
This home is located at 82 Main St, Wakefield, MA 01880 and is currently estimated at $839,034, approximately $466 per square foot. 82 Main St is a home located in Middlesex County with nearby schools including Wakefield Memorial High School and St Joseph School.
Ownership History
Date
Name
Owned For
Owner Type
Purchase Details
Closed on
Apr 30, 2002
Sold by
Lederer David O and Jouzaitis Joan M
Bought by
Herz Susan E and Demiany Frances E
Current Estimated Value
Purchase Details
Closed on
Aug 20, 1992
Sold by
Lynch Muriel F
Bought by
Lederer David O and Jouzaitis Joan M
Create a Home Valuation Report for This Property
The Home Valuation Report is an in-depth analysis detailing your home's value as well as a comparison with similar homes in the area
Home Values in the Area
Average Home Value in this Area
Purchase History
| Date | Buyer | Sale Price | Title Company |
|---|---|---|---|
| Herz Susan E | $382,000 | -- | |
| Lederer David O | $195,000 | -- | |
| Lederer David O | $195,000 | -- |
Source: Public Records
Mortgage History
| Date | Status | Borrower | Loan Amount |
|---|---|---|---|
| Open | Lederer David O | $30,000 | |
| Open | Lederer David O | $128,000 |
Source: Public Records
Tax History
| Year | Tax Paid | Tax Assessment Tax Assessment Total Assessment is a certain percentage of the fair market value that is determined by local assessors to be the total taxable value of land and additions on the property. | Land | Improvement |
|---|---|---|---|---|
| 2025 | $8,169 | $719,700 | $419,700 | $300,000 |
| 2024 | $7,711 | $685,400 | $399,700 | $285,700 |
| 2023 | $7,504 | $639,700 | $373,100 | $266,600 |
| 2022 | $7,037 | $571,200 | $333,100 | $238,100 |
| 2021 | $6,682 | $524,900 | $311,500 | $213,400 |
| 2020 | $6,307 | $493,900 | $293,100 | $200,800 |
| 2019 | $6,098 | $475,300 | $282,700 | $192,600 |
| 2018 | $5,870 | $453,300 | $269,600 | $183,700 |
| 2017 | $5,733 | $440,000 | $261,700 | $178,300 |
| 2016 | $5,351 | $396,700 | $242,700 | $154,000 |
| 2015 | $5,241 | $388,800 | $237,900 | $150,900 |
| 2014 | $4,969 | $388,800 | $237,900 | $150,900 |
Source: Public Records
Map
Nearby Homes
- 270 Lowell St
- 50 Quannapowitt Pkwy
- 29 Cordis St
- 25 Juniper Ave
- 67 Woodcrest Dr
- 395 Vernon St
- 41 Winter St
- 48 Village St Unit 1001
- 16 Pleasant St
- 34 Cedar St
- 43-45 Crescent St
- 95 Prospect St
- 12 Heritage Ln
- 141 Belmont St
- 68 Preston St Unit 6D
- 1 Summit Dr Unit 57
- 4 Adams St
- 269 Main St Unit 4001
- 17 Wakefield St
- 311 Gazebo Cir Unit 311
Your Personal Tour Guide
Ask me questions while you tour the home.