82 Monument Rd Orleans, MA 02653
Estimated Value: $370,000 - $423,000
3
Beds
1
Bath
1,503
Sq Ft
$264/Sq Ft
Est. Value
About This Home
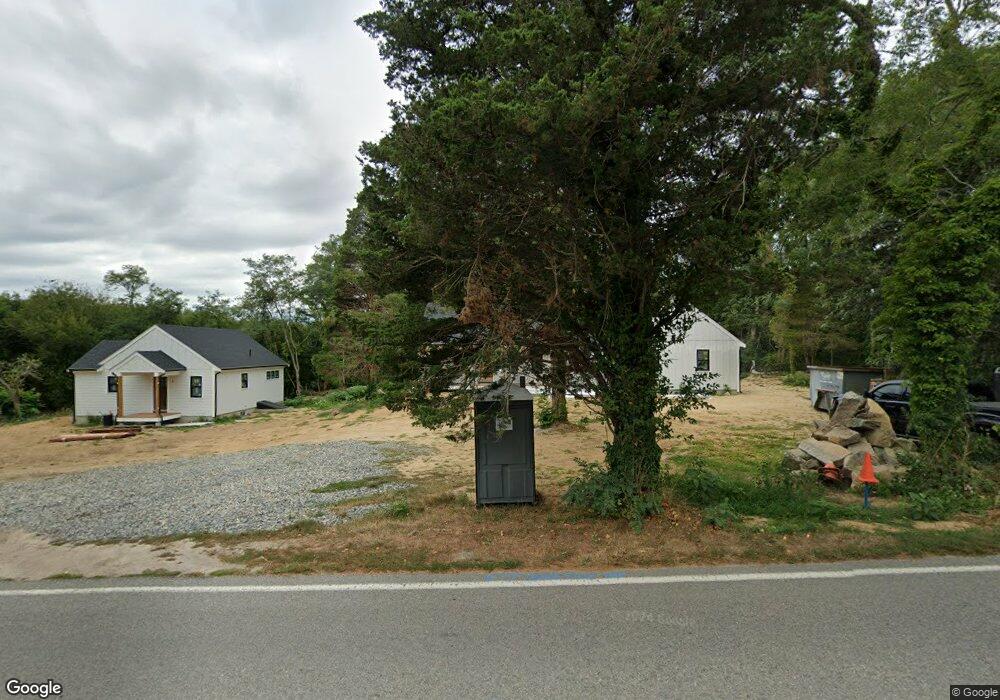
This home is located at 82 Monument Rd, Orleans, MA 02653 and is currently estimated at $396,500, approximately $263 per square foot. 82 Monument Rd is a home located in Barnstable County with nearby schools including Orleans Elementary School, Nauset Regional Middle School, and Nauset Regional High School.
Ownership History
Date
Name
Owned For
Owner Type
Purchase Details
Closed on
Feb 21, 2023
Sold by
Kimball Daniel and Kimball Deborah
Bought by
Kimball Sarah E and Kimball Jessica W
Current Estimated Value
Purchase Details
Closed on
Mar 17, 2020
Sold by
Giffen Roberta Est
Bought by
Kimball Deborah and Kimball Daniel
Purchase Details
Closed on
Oct 12, 2000
Sold by
Est Mayo Alice P and Giffen Roberta
Bought by
Giffen James O and Giffen Roberta
Create a Home Valuation Report for This Property
The Home Valuation Report is an in-depth analysis detailing your home's value as well as a comparison with similar homes in the area
Home Values in the Area
Average Home Value in this Area
Purchase History
| Date | Buyer | Sale Price | Title Company |
|---|---|---|---|
| Kimball Sarah E | -- | None Available | |
| Kimball Sarah E | -- | None Available | |
| Kimball Deborah | $200,000 | None Available | |
| Kimball Deborah | $200,000 | None Available | |
| Giffen James O | $208,000 | -- | |
| Giffen James O | $208,000 | -- |
Source: Public Records
Tax History Compared to Growth
Tax History
| Year | Tax Paid | Tax Assessment Tax Assessment Total Assessment is a certain percentage of the fair market value that is determined by local assessors to be the total taxable value of land and additions on the property. | Land | Improvement |
|---|---|---|---|---|
| 2025 | $1,845 | $295,600 | $295,600 | $0 |
| 2024 | $3,347 | $522,100 | $289,700 | $232,400 |
| 2023 | $3,011 | $483,300 | $268,400 | $214,900 |
| 2022 | $2,744 | $381,100 | $244,000 | $137,100 |
| 2021 | $2,723 | $347,300 | $236,300 | $111,000 |
| 2020 | $2,689 | $355,700 | $246,900 | $108,800 |
| 2019 | $2,413 | $326,100 | $219,400 | $106,700 |
| 2018 | $2,106 | $317,700 | $215,200 | $102,500 |
| 2017 | $1,981 | $312,900 | $215,200 | $97,700 |
| 2016 | $1,998 | $309,300 | $213,500 | $95,800 |
| 2015 | $1,878 | $292,600 | $199,500 | $93,100 |
Source: Public Records
Map
Nearby Homes