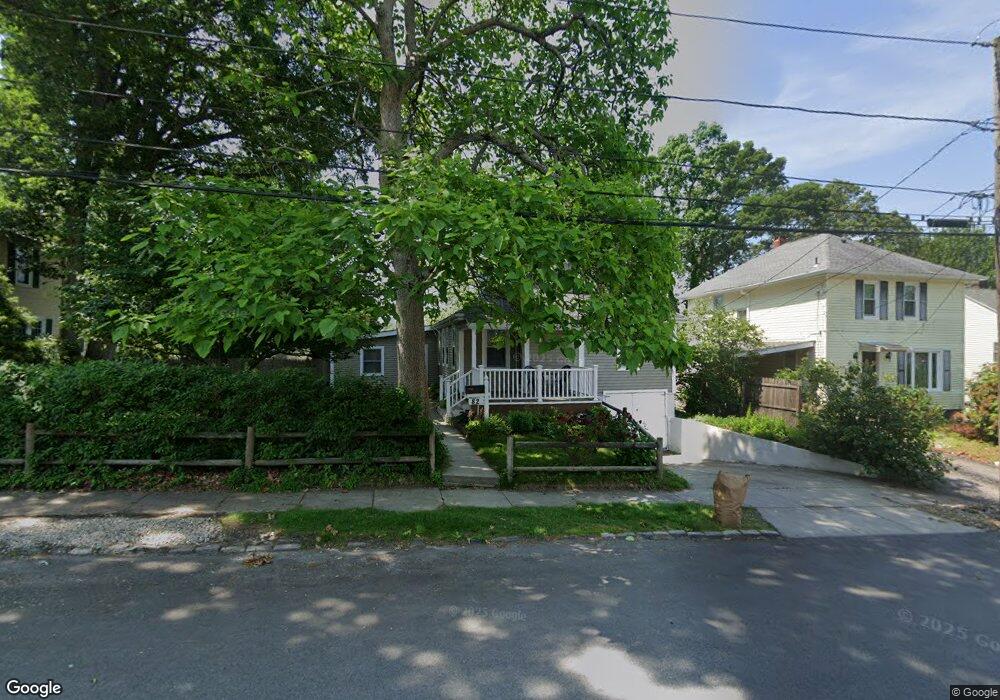
82 Norman Ave Cranston, RI 02910
Eden Park NeighborhoodEstimated Value: $410,996 - $448,000
3
Beds
1
Bath
1,128
Sq Ft
$379/Sq Ft
Est. Value
About This Home
This home is located at 82 Norman Ave, Cranston, RI 02910 and is currently estimated at $427,749, approximately $379 per square foot. 82 Norman Ave is a home located in Providence County with nearby schools including Park View Middle School, Cranston High School East, and Cadence Academy Preschool - Cranston.
Ownership History
Date
Name
Owned For
Owner Type
Purchase Details
Closed on
May 7, 2025
Sold by
Heath Jeffrey D and Heath Nancy M
Bought by
Jeffrey David Heath Lt and Heath
Current Estimated Value
Purchase Details
Closed on
Jul 15, 1999
Sold by
Spero John and Spero Patricia M
Bought by
Heath Jeffrey D and Heath Nancy M
Home Financials for this Owner
Home Financials are based on the most recent Mortgage that was taken out on this home.
Original Mortgage
$92,000
Interest Rate
7.39%
Create a Home Valuation Report for This Property
The Home Valuation Report is an in-depth analysis detailing your home's value as well as a comparison with similar homes in the area
Home Values in the Area
Average Home Value in this Area
Purchase History
| Date | Buyer | Sale Price | Title Company |
|---|---|---|---|
| Jeffrey David Heath Lt | -- | None Available | |
| Jeffrey David Heath Lt | -- | None Available | |
| Heath Jeffrey D | $92,500 | -- | |
| Heath Jeffrey D | $92,500 | -- |
Source: Public Records
Mortgage History
| Date | Status | Borrower | Loan Amount |
|---|---|---|---|
| Previous Owner | Heath Jeffrey D | $30,000 | |
| Previous Owner | Heath Jeffrey D | $92,000 |
Source: Public Records
Tax History
| Year | Tax Paid | Tax Assessment Tax Assessment Total Assessment is a certain percentage of the fair market value that is determined by local assessors to be the total taxable value of land and additions on the property. | Land | Improvement |
|---|---|---|---|---|
| 2025 | $4,612 | $332,300 | $103,800 | $228,500 |
| 2024 | $4,523 | $332,300 | $103,800 | $228,500 |
| 2023 | $4,020 | $212,700 | $68,300 | $144,400 |
| 2022 | $3,937 | $212,700 | $68,300 | $144,400 |
| 2021 | $3,829 | $212,700 | $68,300 | $144,400 |
| 2020 | $3,672 | $176,800 | $65,100 | $111,700 |
| 2019 | $3,672 | $176,800 | $65,100 | $111,700 |
| 2018 | $3,587 | $176,800 | $65,100 | $111,700 |
| 2017 | $3,315 | $144,500 | $58,600 | $85,900 |
| 2016 | $3,244 | $144,500 | $58,600 | $85,900 |
| 2015 | $3,244 | $144,500 | $58,600 | $85,900 |
| 2014 | $3,074 | $134,600 | $58,600 | $76,000 |
Source: Public Records
Map
Nearby Homes
Your Personal Tour Guide
Ask me questions while you tour the home.