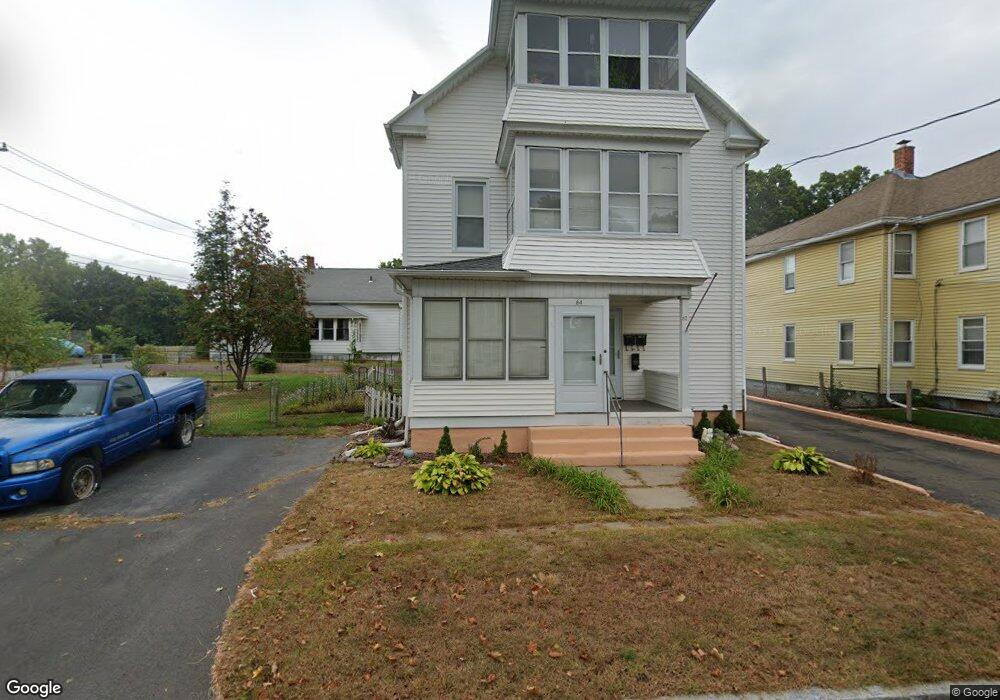
82 Olea St Chicopee, MA 01020
Aldenville NeighborhoodEstimated Value: $270,362 - $426,000
6
Beds
3
Baths
2,223
Sq Ft
$156/Sq Ft
Est. Value
About This Home
This home is located at 82 Olea St, Chicopee, MA 01020 and is currently estimated at $346,591, approximately $155 per square foot. 82 Olea St is a home located in Hampden County with nearby schools including Lambert-Lavoie Elementary School, Fairview Middle School, and Chicopee Comprehensive High School.
Ownership History
Date
Name
Owned For
Owner Type
Purchase Details
Closed on
Apr 6, 1998
Sold by
Gardner Walter R
Bought by
Gay Holly A
Current Estimated Value
Home Financials for this Owner
Home Financials are based on the most recent Mortgage that was taken out on this home.
Original Mortgage
$76,550
Interest Rate
6.89%
Mortgage Type
Purchase Money Mortgage
Create a Home Valuation Report for This Property
The Home Valuation Report is an in-depth analysis detailing your home's value as well as a comparison with similar homes in the area
Home Values in the Area
Average Home Value in this Area
Purchase History
| Date | Buyer | Sale Price | Title Company |
|---|---|---|---|
| Gay Holly A | $78,300 | -- |
Source: Public Records
Mortgage History
| Date | Status | Borrower | Loan Amount |
|---|---|---|---|
| Open | Gay Holly A | $76,000 | |
| Closed | Gay Holly A | $76,550 |
Source: Public Records
Tax History Compared to Growth
Tax History
| Year | Tax Paid | Tax Assessment Tax Assessment Total Assessment is a certain percentage of the fair market value that is determined by local assessors to be the total taxable value of land and additions on the property. | Land | Improvement |
|---|---|---|---|---|
| 2025 | $4,345 | $286,600 | $80,900 | $205,700 |
| 2024 | $4,041 | $273,800 | $79,300 | $194,500 |
| 2023 | $3,750 | $247,500 | $72,100 | $175,400 |
| 2022 | $3,719 | $218,900 | $62,700 | $156,200 |
| 2021 | $3,527 | $200,300 | $56,900 | $143,400 |
| 2020 | $3,323 | $190,300 | $56,400 | $133,900 |
| 2019 | $3,299 | $183,700 | $56,400 | $127,300 |
| 2018 | $3,226 | $176,200 | $53,700 | $122,500 |
| 2017 | $3,100 | $179,100 | $54,700 | $124,400 |
| 2016 | $2,865 | $169,400 | $54,700 | $114,700 |
| 2015 | $2,657 | $151,500 | $54,700 | $96,800 |
| 2014 | $2,501 | $151,500 | $54,700 | $96,800 |
Source: Public Records
Map
Nearby Homes
- 10 Rivest Ct
- 664 Mckinstry Ave
- 625 Mckinstry Ave
- 199 Meadow St
- 19 Dale Ct
- 62 Charpentier Blvd
- 175 Pendexter Ave
- 44 Charpentier Blvd
- 541 Grattan St
- 47 Dorrance St
- 599 Chicopee St
- 70 Empire St
- 40 Greenwich St
- 14 Norman St
- 80 Stewart St
- 26 Olivine St
- 757 Chicopee St
- 219 Clarendon Ave
- 158 Narragansett Blvd
- 69 Daley St