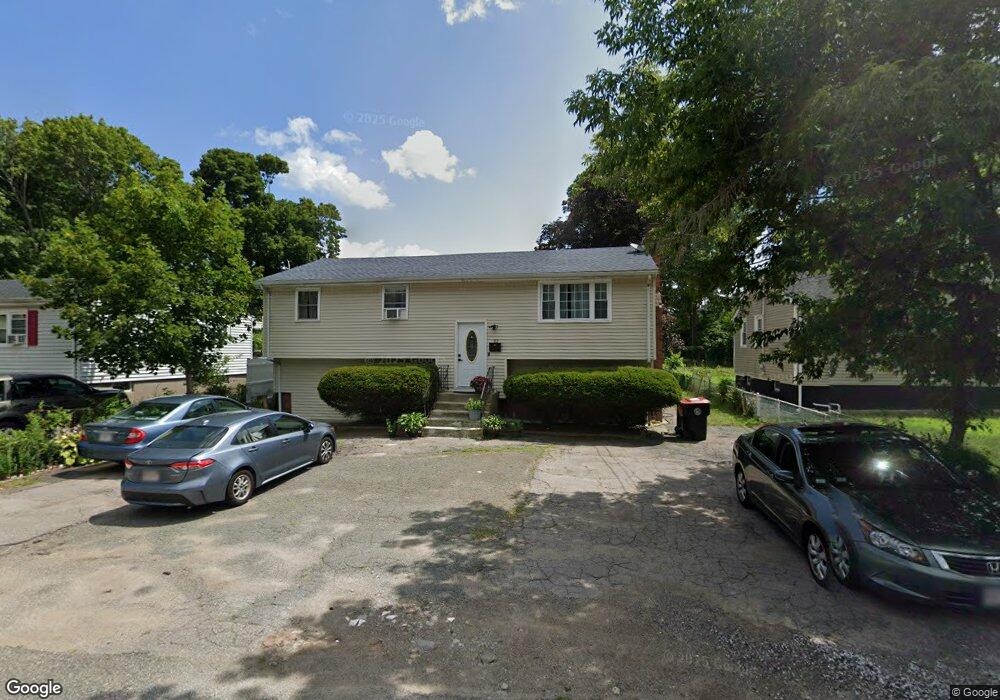
82 Packard Way Brockton, MA 02301
Clifton Heights NeighborhoodEstimated Value: $490,000 - $555,000
3
Beds
2
Baths
1,930
Sq Ft
$270/Sq Ft
Est. Value
About This Home
This home is located at 82 Packard Way, Brockton, MA 02301 and is currently estimated at $521,791, approximately $270 per square foot. 82 Packard Way is a home located in Plymouth County with nearby schools including Gilmore Elementary School, John F. Kennedy Elementary School, and Davis K-8 School.
Ownership History
Date
Name
Owned For
Owner Type
Purchase Details
Closed on
Jun 30, 1998
Sold by
Sullivan Christopher
Bought by
Beausejour-Antoine
Current Estimated Value
Home Financials for this Owner
Home Financials are based on the most recent Mortgage that was taken out on this home.
Original Mortgage
$100,424
Interest Rate
7.09%
Mortgage Type
Purchase Money Mortgage
Purchase Details
Closed on
Oct 24, 1997
Sold by
Brockton City Of
Bought by
Sullivan Christopher
Purchase Details
Closed on
Feb 9, 1993
Sold by
Conyers Const Co Inc
Bought by
Morris T Chartkoff
Create a Home Valuation Report for This Property
The Home Valuation Report is an in-depth analysis detailing your home's value as well as a comparison with similar homes in the area
Home Values in the Area
Average Home Value in this Area
Purchase History
| Date | Buyer | Sale Price | Title Company |
|---|---|---|---|
| Beausejour-Antoine | $100,500 | -- | |
| Sullivan Christopher | $32,010 | -- | |
| Morris T Chartkoff | $15,000 | -- |
Source: Public Records
Mortgage History
| Date | Status | Borrower | Loan Amount |
|---|---|---|---|
| Open | Morris T Chartkoff | $200,850 | |
| Closed | Morris T Chartkoff | $180,000 | |
| Closed | Morris T Chartkoff | $137,000 | |
| Closed | Morris T Chartkoff | $100,424 |
Source: Public Records
Tax History
| Year | Tax Paid | Tax Assessment Tax Assessment Total Assessment is a certain percentage of the fair market value that is determined by local assessors to be the total taxable value of land and additions on the property. | Land | Improvement |
|---|---|---|---|---|
| 2025 | $5,440 | $449,200 | $140,200 | $309,000 |
| 2024 | $5,241 | $436,000 | $140,200 | $295,800 |
| 2023 | $5,183 | $399,300 | $105,100 | $294,200 |
| 2022 | $4,596 | $329,000 | $95,600 | $233,400 |
| 2021 | $5,961 | $294,700 | $79,500 | $215,200 |
| 2020 | $4,107 | $271,100 | $74,300 | $196,800 |
| 2019 | $5,076 | $244,900 | $72,500 | $172,400 |
| 2018 | $4,876 | $226,800 | $72,500 | $154,300 |
| 2017 | $3,479 | $216,100 | $72,500 | $143,600 |
| 2016 | $3,491 | $201,100 | $70,300 | $130,800 |
| 2015 | $3,209 | $176,800 | $70,300 | $106,500 |
| 2014 | $2,881 | $158,900 | $70,300 | $88,600 |
Source: Public Records
Map
Nearby Homes
Your Personal Tour Guide
Ask me questions while you tour the home.