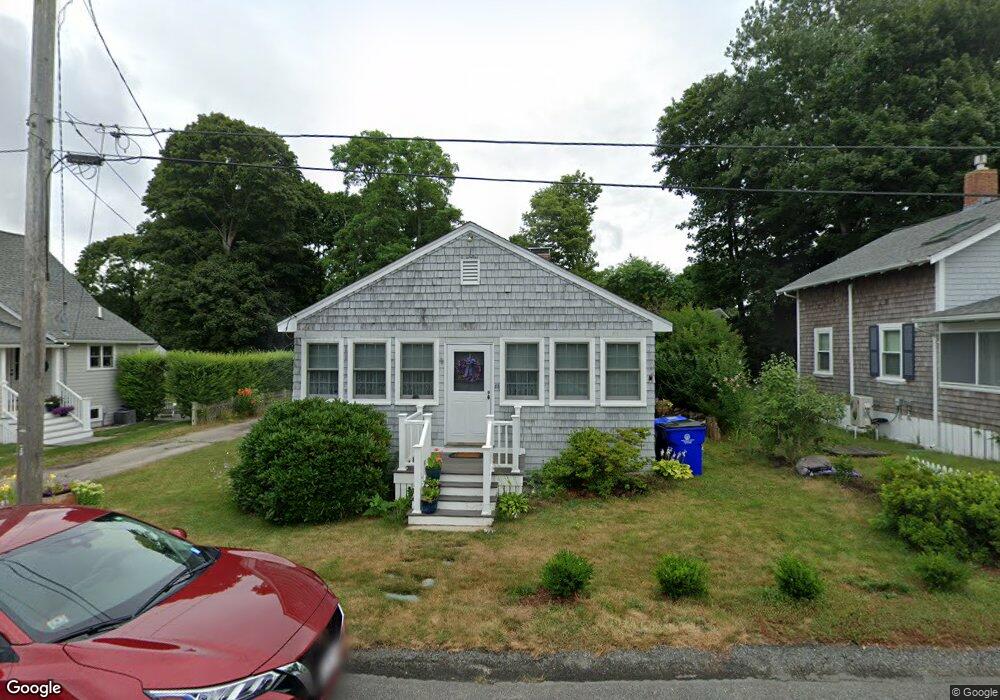
82 Prospect Ave Pocasset, MA 02559
Pocasset NeighborhoodEstimated Value: $771,000 - $850,000
2
Beds
3
Baths
1,416
Sq Ft
$563/Sq Ft
Est. Value
About This Home
This home is located at 82 Prospect Ave, Pocasset, MA 02559 and is currently estimated at $797,784, approximately $563 per square foot. 82 Prospect Ave is a home located in Barnstable County with nearby schools including Bourne High School and Cadence Academy Preschool - Bourne.
Ownership History
Date
Name
Owned For
Owner Type
Purchase Details
Closed on
Jan 18, 2023
Sold by
Straffin Richard
Bought by
Conefrey Virginia B
Current Estimated Value
Purchase Details
Closed on
Jun 17, 1998
Sold by
Est Lee Lennie I and Straffin Weston F
Bought by
Conefrey Virginia D
Create a Home Valuation Report for This Property
The Home Valuation Report is an in-depth analysis detailing your home's value as well as a comparison with similar homes in the area
Home Values in the Area
Average Home Value in this Area
Purchase History
| Date | Buyer | Sale Price | Title Company |
|---|---|---|---|
| Conefrey Virginia B | -- | None Available | |
| Conefrey Virginia B | -- | None Available | |
| Conefrey Virginia B | -- | None Available | |
| Conefrey Virginia D | $117,500 | -- | |
| Conefrey Virginia D | $117,500 | -- |
Source: Public Records
Mortgage History
| Date | Status | Borrower | Loan Amount |
|---|---|---|---|
| Previous Owner | Conefrey Virginia D | $182,500 | |
| Previous Owner | Conefrey Virginia D | $75,000 | |
| Previous Owner | Conefrey Virginia D | $17,000 | |
| Previous Owner | Conefrey Virginia D | $88,000 |
Source: Public Records
Tax History Compared to Growth
Tax History
| Year | Tax Paid | Tax Assessment Tax Assessment Total Assessment is a certain percentage of the fair market value that is determined by local assessors to be the total taxable value of land and additions on the property. | Land | Improvement |
|---|---|---|---|---|
| 2025 | $5,331 | $682,600 | $400,700 | $281,900 |
| 2024 | $5,372 | $669,800 | $381,600 | $288,200 |
| 2023 | $5,222 | $592,700 | $337,700 | $255,000 |
| 2022 | $4,738 | $469,600 | $264,900 | $204,700 |
| 2021 | $4,604 | $427,500 | $241,100 | $186,400 |
| 2020 | $4,470 | $416,200 | $238,800 | $177,400 |
| 2019 | $4,270 | $406,300 | $238,800 | $167,500 |
| 2018 | $3,861 | $366,300 | $233,300 | $133,000 |
| 2017 | $3,737 | $362,800 | $231,100 | $131,700 |
| 2016 | $3,316 | $326,400 | $219,500 | $106,900 |
| 2015 | $3,113 | $309,100 | $202,200 | $106,900 |
Source: Public Records
Map
Nearby Homes
- 171 Bellavista Dr
- 22 Nairn Rd
- 254 Barlows Landing Rd
- 34 Kenwood Rd
- 45 Kenwood Rd
- 70 Wings Neck Rd
- 940 County Rd
- 48 Red Brook Harbor Rd
- 709 County Rd
- 24 Richmond Rd
- 3 Red Brook Pond Dr
- 14 Navajo Rd
- 940 County Rd
- 1094 County Rd
- 174 Barlows Landing Rd
- 7 4th Ave
- 15 1st St
- 39 Bennets Neck Dr
- 89 Harbor Dr