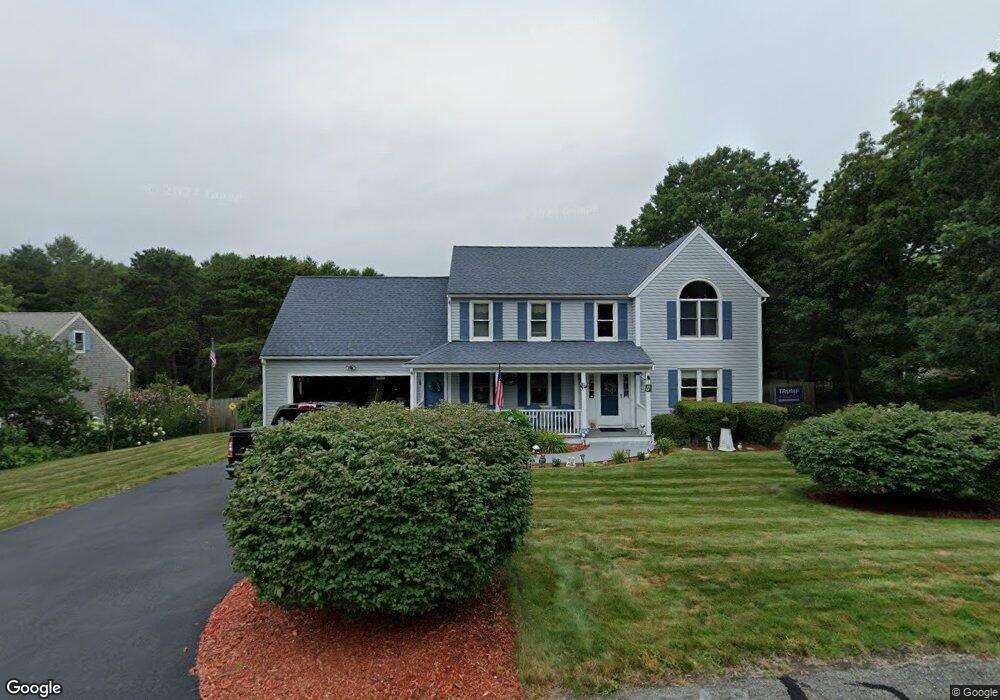
82 Spinnaker Ln Pocasset, MA 02559
Pocasset NeighborhoodEstimated Value: $635,943 - $751,000
3
Beds
2
Baths
2,020
Sq Ft
$343/Sq Ft
Est. Value
About This Home
This home is located at 82 Spinnaker Ln, Pocasset, MA 02559 and is currently estimated at $692,736, approximately $342 per square foot. 82 Spinnaker Ln is a home located in Barnstable County with nearby schools including Bourne High School, Cadence Academy Preschool - Bourne, and St Margaret Regional School.
Ownership History
Date
Name
Owned For
Owner Type
Purchase Details
Closed on
May 31, 2013
Sold by
Sweeney Susan C
Bought by
Sweeney Susan C and Sweeney Susan
Current Estimated Value
Home Financials for this Owner
Home Financials are based on the most recent Mortgage that was taken out on this home.
Original Mortgage
$254,000
Outstanding Balance
$179,127
Interest Rate
3.45%
Mortgage Type
New Conventional
Estimated Equity
$513,609
Purchase Details
Closed on
Oct 28, 2011
Sold by
Sweeney John E and Sweeney Susan C
Bought by
Sweeney Susan C
Purchase Details
Closed on
Nov 29, 2004
Sold by
Sweeney John E and Sweeney Susan C
Bought by
Sweeney John E and Sweeney Susan C
Purchase Details
Closed on
Jul 21, 1995
Sold by
Pocasset Woods Rt and Priestly Donald H
Bought by
Sweeney John E and Sweeney Susan C
Create a Home Valuation Report for This Property
The Home Valuation Report is an in-depth analysis detailing your home's value as well as a comparison with similar homes in the area
Home Values in the Area
Average Home Value in this Area
Purchase History
| Date | Buyer | Sale Price | Title Company |
|---|---|---|---|
| Sweeney Susan C | -- | -- | |
| Sweeney Susan C | -- | -- | |
| Sweeney Susan C | -- | -- | |
| Sweeney Susan C | -- | -- | |
| Sweeney Susan C | -- | -- | |
| Sweeney Susan C | -- | -- | |
| Sweeney John E | $10,000 | -- | |
| Sweeney John E | $10,000 | -- | |
| Sweeney John E | $10,000 | -- | |
| Sweeney John E | $151,000 | -- | |
| Sweeney John E | $151,000 | -- |
Source: Public Records
Mortgage History
| Date | Status | Borrower | Loan Amount |
|---|---|---|---|
| Open | Sweeney Susan C | $254,000 | |
| Closed | Sweeney John E | $254,000 |
Source: Public Records
Tax History Compared to Growth
Tax History
| Year | Tax Paid | Tax Assessment Tax Assessment Total Assessment is a certain percentage of the fair market value that is determined by local assessors to be the total taxable value of land and additions on the property. | Land | Improvement |
|---|---|---|---|---|
| 2025 | $4,341 | $555,800 | $190,300 | $365,500 |
| 2024 | $4,263 | $531,600 | $181,300 | $350,300 |
| 2023 | $4,150 | $471,000 | $160,400 | $310,600 |
| 2022 | $3,961 | $392,600 | $142,000 | $250,600 |
| 2021 | $3,884 | $360,600 | $129,200 | $231,400 |
| 2020 | $3,767 | $350,700 | $128,000 | $222,700 |
| 2019 | $3,585 | $341,100 | $128,000 | $213,100 |
| 2018 | $3,452 | $327,500 | $121,900 | $205,600 |
| 2017 | $3,364 | $326,600 | $120,700 | $205,900 |
| 2016 | $3,185 | $313,500 | $114,700 | $198,800 |
| 2015 | $3,157 | $313,500 | $114,700 | $198,800 |
Source: Public Records
Map
Nearby Homes
- 84 Spinnaker Ln
- 80 Spinnaker Ln
- 81 Spinnaker Ln
- 86 Spinnaker Ln
- 79 Spinnaker Ln
- 59 Spinnaker Ln
- 78 Spinnaker Ln
- 75 Spinnaker Ln
- 57 Spinnaker Ln
- 61 Spinnaker Ln
- 74 Spinnaker Ln
- 55 Spinnaker Ln
- 73 Spinnaker Ln
- 72 Spinnaker Ln
- 63 Spinnaker Ln
- 63 Spinnaker Ln Unit 2
- 70 Spinnaker Ln
- 71 Spinnaker Ln
- 71 Spinnaker Ln
- 71 Spinnaker Ln