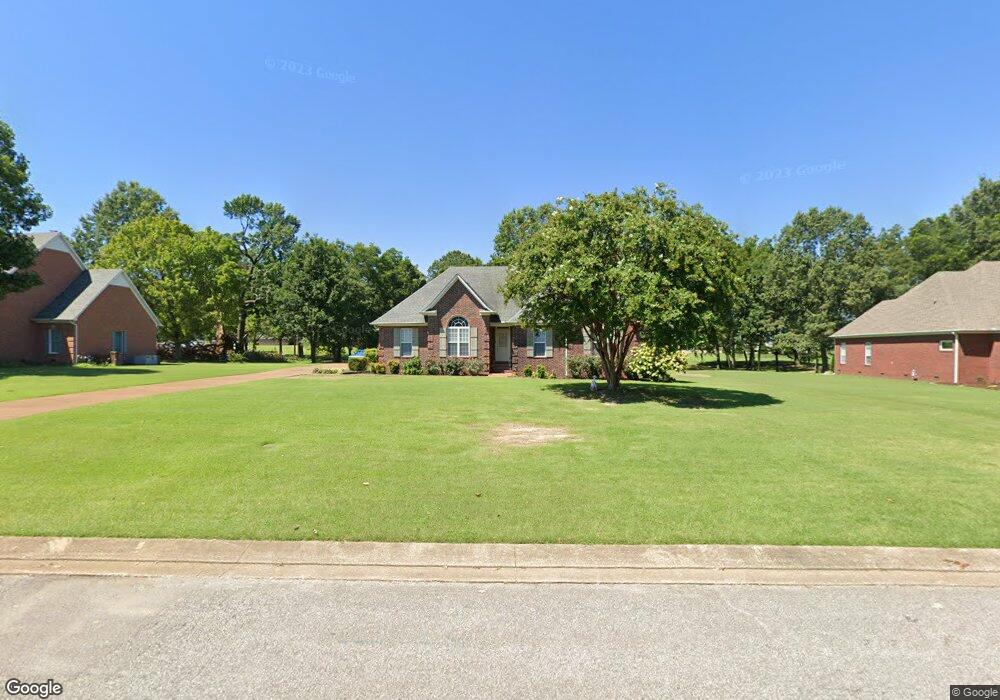
82 Wilmington Cove Jackson, TN 38305
Estimated Value: $311,000 - $452,000
--
Bed
3
Baths
2,660
Sq Ft
$144/Sq Ft
Est. Value
About This Home
This home is located at 82 Wilmington Cove, Jackson, TN 38305 and is currently estimated at $383,936, approximately $144 per square foot. 82 Wilmington Cove is a home located in Madison County with nearby schools including Pope School, Northeast Middle School, and North Side High School.
Ownership History
Date
Name
Owned For
Owner Type
Purchase Details
Closed on
Jul 8, 2021
Sold by
Spore Jerry P
Bought by
Batdorf John R and Batdorf Melissa
Current Estimated Value
Home Financials for this Owner
Home Financials are based on the most recent Mortgage that was taken out on this home.
Original Mortgage
$234,240
Outstanding Balance
$212,731
Interest Rate
2.96%
Mortgage Type
New Conventional
Estimated Equity
$171,205
Purchase Details
Closed on
Aug 26, 2010
Sold by
Buckley William D
Bought by
Spore Jerry P
Purchase Details
Closed on
Jul 21, 2006
Sold by
Parrish Jonathan V
Bought by
Buckley William D
Home Financials for this Owner
Home Financials are based on the most recent Mortgage that was taken out on this home.
Original Mortgage
$176,000
Interest Rate
6.68%
Purchase Details
Closed on
Nov 1, 1998
Bought by
Parrish Jonathan
Purchase Details
Closed on
Apr 27, 1998
Bought by
Durbin Const Co
Create a Home Valuation Report for This Property
The Home Valuation Report is an in-depth analysis detailing your home's value as well as a comparison with similar homes in the area
Home Values in the Area
Average Home Value in this Area
Purchase History
| Date | Buyer | Sale Price | Title Company |
|---|---|---|---|
| Batdorf John R | $292,800 | None Available | |
| Spore Jerry P | $215,000 | -- | |
| Buckley William D | $220,000 | -- | |
| Parrish Jonathan | $132,000 | -- | |
| Durbin Const Co | $27,500 | -- |
Source: Public Records
Mortgage History
| Date | Status | Borrower | Loan Amount |
|---|---|---|---|
| Open | Batdorf John R | $234,240 | |
| Previous Owner | Durbin Const Co | $176,000 |
Source: Public Records
Tax History Compared to Growth
Tax History
| Year | Tax Paid | Tax Assessment Tax Assessment Total Assessment is a certain percentage of the fair market value that is determined by local assessors to be the total taxable value of land and additions on the property. | Land | Improvement |
|---|---|---|---|---|
| 2024 | $1,317 | $70,275 | $8,750 | $61,525 |
| 2022 | $2,449 | $70,275 | $8,750 | $61,525 |
| 2021 | $2,152 | $49,925 | $7,500 | $42,425 |
| 2020 | $2,152 | $49,925 | $7,500 | $42,425 |
| 2019 | $2,152 | $49,925 | $7,500 | $42,425 |
| 2018 | $2,152 | $49,925 | $7,500 | $42,425 |
| 2017 | $2,112 | $47,875 | $7,500 | $40,375 |
| 2016 | $1,968 | $47,875 | $7,500 | $40,375 |
| 2015 | $1,969 | $47,875 | $7,500 | $40,375 |
| 2014 | $1,974 | $48,000 | $7,500 | $40,500 |
Source: Public Records
Map
Nearby Homes
- 152 Sommersby Dr
- 29 Kensington Cove
- 46 Northwyke Dr
- 51 Crownpointe Cove
- 8 Prestwick Dr
- 60 Greendale Dr
- 26 Applestone Dr
- 23 Vandenburg Cove
- 32 Hollinsworth Cove
- 119 Stonehenge Dr
- 27 Greendale Dr
- 119 Wyndchase Dr
- 107 Wyndchase Dr
- 4 Rochester Cove
- 61 Rochester Cove
- 142 Larkwood Dr
- 189 Wyndchase Dr
- 8 Bold Meadow Cove
- 114 Larkwood Dr
- 465 Shadow Ridge Dr
- 94 Wilmington Cove
- 70 Wilmington Cove
- 81 Wilmington Cove
- 106 Wilmington Cove
- 95 Wilmington Cove
- 67 Wilmington Cove
- 50 Wilmington Cove
- 105 Wilmington Cove
- 118 Wilmington Cove
- 30 Wilmington Cove
- 113 Sommersby Dr
- 99 Sommersby Dr
- 119 Wilmington Cove
- 81 Sommersby Dr
- 125 Sommersby Dr
- 139 Sommersby Dr
- 73 Sommersby Dr
- 153 Sommersby Dr
- 61 Sommersby Dr
- 167 Sommersby Dr