J
Seller's Agent in 2026
Jordan Buchman
Keller Williams Realty River Cities
(706) 289-7925
2 in this area
51 Total Sales
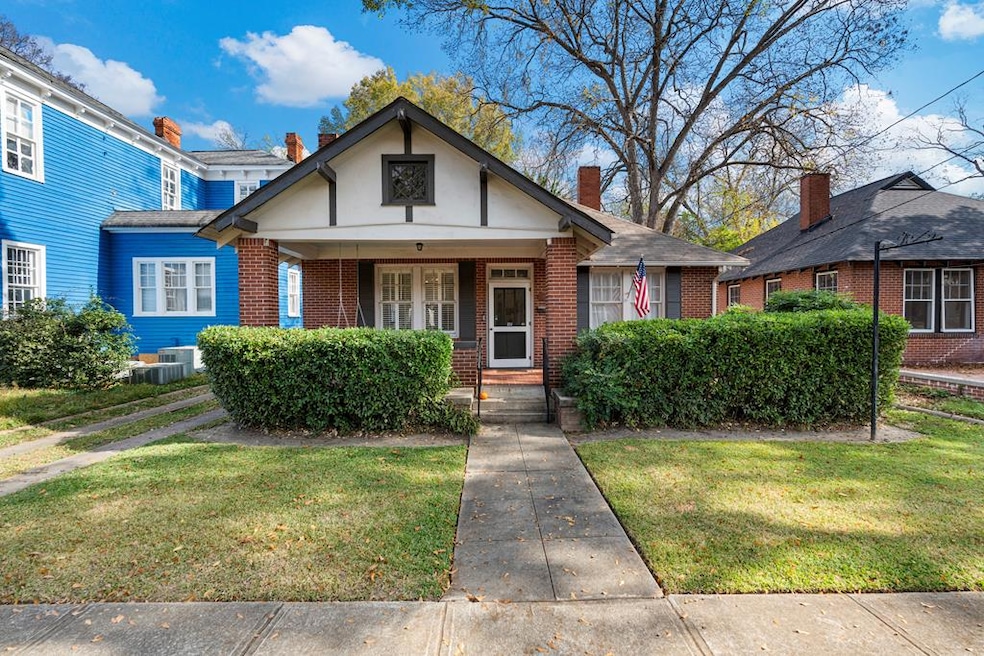

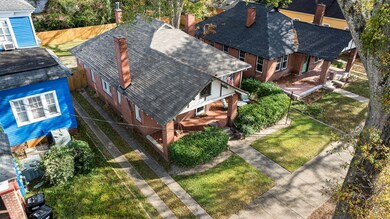
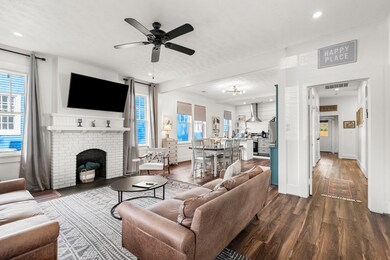
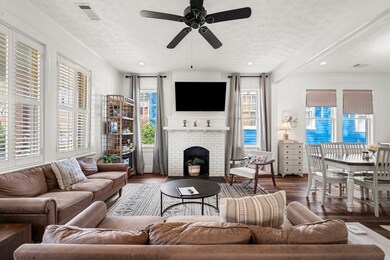
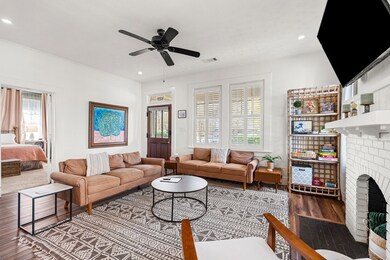
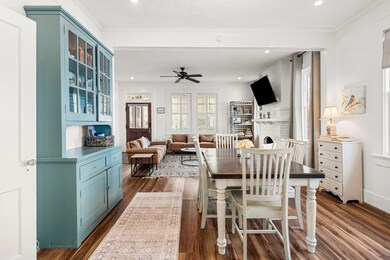
Welcome to this beautifully updated 3-bedroom, 1-bath home with an office perfectly positioned in the heart of Uptown Columbus. Just minutes from local shops, restaurants, the Riverwalk, and beloved historical sites, this home offers the ideal blend of convenience, charm, and opportunity. Inside, you'll find a bright and inviting layout with modern updates that complement the home's original character. The living spaces feel warm and comfortable, each bedroom offers great natural light, and the refreshed bathroom brings a clean, stylish touch. Step outside to your private, fenced backyard—ideal for pets, small gatherings, or simply unwinding after a day exploring Uptown. Adding tremendous value, this property currently holds a short-term rental permit with the City of Columbus and generated approximately $60,000 in rental revenue in 2025, making it a fantastic option for investors, owner-occupants seeking extra income, or anyone looking to enjoy a turnkey opportunity in a high-demand area. With walkable city living, modern updates, and strong rental performance, this Uptown gem truly offers the best of both lifestyle and investment. Come see all that this remarkable home has to offer!
Last Agent to Sell the Property
Keller Williams Realty River Cities Brokerage Phone: 7062216900 License #444372 Listed on: 12/02/2025

| Date | Type | Sale Price | Title Company |
|---|---|---|---|
| Special Warranty Deed | -- | None Listed On Document | |
| Special Warranty Deed | $315,300 | None Listed On Document | |
| Special Warranty Deed | $304,000 | None Listed On Document | |
| Warranty Deed | $75,000 | -- |
| Date | Status | Loan Amount | Loan Type |
|---|---|---|---|
| Open | $252,240 | New Conventional | |
| Previous Owner | $228,000 | New Conventional | |
| Previous Owner | $65,000 | Commercial |
| Date | Event | Price | List to Sale | Price per Sq Ft |
|---|---|---|---|---|
| 01/15/2026 01/15/26 | Sold | $315,300 | -1.5% | $197 / Sq Ft |
| 12/06/2025 12/06/25 | Pending | -- | -- | -- |
| 12/02/2025 12/02/25 | For Sale | $320,000 | -- | $200 / Sq Ft |
| Year | Tax Paid | Tax Assessment Tax Assessment Total Assessment is a certain percentage of the fair market value that is determined by local assessors to be the total taxable value of land and additions on the property. | Land | Improvement |
|---|---|---|---|---|
| 2025 | $2,217 | $117,596 | $20,364 | $97,232 |
| 2024 | $2,217 | $56,644 | $21,172 | $35,472 |
| 2023 | $2,231 | $56,644 | $21,172 | $35,472 |
| 2022 | $2,048 | $50,156 | $21,172 | $28,984 |
| 2021 | $1,696 | $41,376 | $21,172 | $20,204 |
| 2020 | $1,690 | $41,376 | $21,172 | $20,204 |
| 2019 | $1,503 | $47,984 | $21,172 | $26,812 |
| 2018 | $1,503 | $36,680 | $10,584 | $26,096 |
| 2017 | $1,508 | $36,680 | $10,584 | $26,096 |
| 2016 | $1,485 | $36,000 | $13,766 | $22,234 |
| 2015 | $1,487 | $36,000 | $13,766 | $22,234 |
| 2014 | $1,489 | $36,000 | $13,766 | $22,234 |
| 2013 | $1,490 | $36,000 | $13,766 | $22,234 |
J
Seller's Agent in 2026
Jordan Buchman
Keller Williams Realty River Cities
(706) 289-7925
2 in this area
51 Total Sales
Buyer's Agent in 2026
Alex Roper
Coldwell Banker / Kennon, Parker, Duncan & Davis
(706) 575-3487
1 in this area
70 Total Sales
Source: Columbus Board of REALTORS® (GA)
MLS Number: 224790
APN: 003-007-017
Disclaimer: Certain information contained herein is derived from information provided by parties other than Homes.com. All information provided is deemed reliable, but is not guaranteed to be accurate and should be independently verified.
![]() IDX information is provided exclusively for personal, non-commercial use, and may not be used for any purpose other than to identify prospective properties consumers may be interested in purchasing. Information is deemed reliable but not guaranteed.
IDX information is provided exclusively for personal, non-commercial use, and may not be used for any purpose other than to identify prospective properties consumers may be interested in purchasing. Information is deemed reliable but not guaranteed.
Ask me questions while you tour the home.