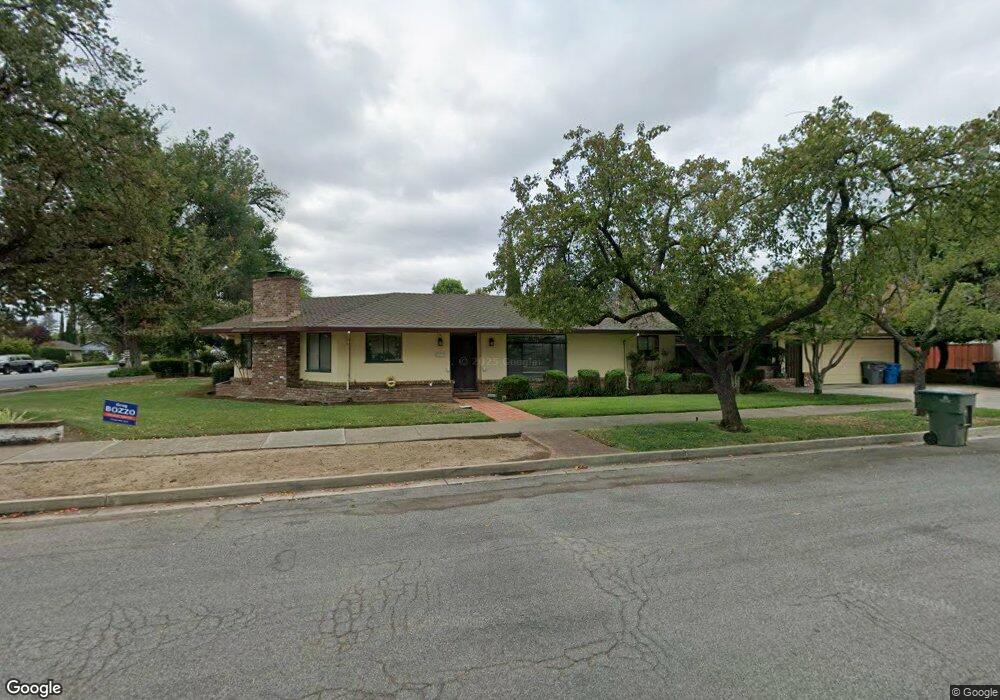
820 2nd St Gilroy, CA 95020
Estimated Value: $953,000 - $1,092,000
2
Beds
2
Baths
1,934
Sq Ft
$531/Sq Ft
Est. Value
About This Home
This home is located at 820 2nd St, Gilroy, CA 95020 and is currently estimated at $1,026,073, approximately $530 per square foot. 820 2nd St is a home located in Santa Clara County with nearby schools including El Roble Elementary School, Brownell Middle School, and Solorsano Middle School.
Ownership History
Date
Name
Owned For
Owner Type
Purchase Details
Closed on
Oct 6, 2016
Sold by
Diaz Henry A
Bought by
Diaz Henry A
Current Estimated Value
Purchase Details
Closed on
Sep 21, 2009
Sold by
Diaz Henry A and Diaz Rachel R L
Bought by
Diaz Henry A and Diaz Rachel R L
Purchase Details
Closed on
Mar 12, 2004
Sold by
Flores Arthur C
Bought by
Diaz Henry A and Diaz Rachel Rl
Home Financials for this Owner
Home Financials are based on the most recent Mortgage that was taken out on this home.
Original Mortgage
$80,000
Outstanding Balance
$37,441
Interest Rate
5.69%
Mortgage Type
Purchase Money Mortgage
Estimated Equity
$988,632
Purchase Details
Closed on
May 15, 2000
Sold by
Martin Robert J and Martin Pamela S
Bought by
Flores Arthur C
Home Financials for this Owner
Home Financials are based on the most recent Mortgage that was taken out on this home.
Original Mortgage
$529,000
Interest Rate
8.08%
Mortgage Type
Stand Alone First
Create a Home Valuation Report for This Property
The Home Valuation Report is an in-depth analysis detailing your home's value as well as a comparison with similar homes in the area
Home Values in the Area
Average Home Value in this Area
Purchase History
| Date | Buyer | Sale Price | Title Company |
|---|---|---|---|
| Diaz Henry A | -- | None Available | |
| Diaz Henry A | -- | None Available | |
| Diaz Henry A | $575,000 | Fidelity National Title Ins | |
| Flores Arthur C | $529,000 | Chicago Title Co |
Source: Public Records
Mortgage History
| Date | Status | Borrower | Loan Amount |
|---|---|---|---|
| Open | Diaz Henry A | $80,000 | |
| Previous Owner | Flores Arthur C | $529,000 |
Source: Public Records
Tax History
| Year | Tax Paid | Tax Assessment Tax Assessment Total Assessment is a certain percentage of the fair market value that is determined by local assessors to be the total taxable value of land and additions on the property. | Land | Improvement |
|---|---|---|---|---|
| 2025 | $9,945 | $817,511 | $449,563 | $367,948 |
| 2024 | $9,945 | $801,483 | $440,749 | $360,734 |
| 2023 | $9,887 | $785,768 | $432,107 | $353,661 |
| 2022 | $9,726 | $770,362 | $423,635 | $346,727 |
| 2021 | $9,684 | $755,258 | $415,329 | $339,929 |
| 2020 | $9,578 | $747,515 | $411,071 | $336,444 |
| 2019 | $9,489 | $732,859 | $403,011 | $329,848 |
| 2018 | $8,817 | $715,000 | $393,100 | $321,900 |
| 2017 | $7,763 | $603,000 | $331,500 | $271,500 |
| 2016 | $7,200 | $559,000 | $307,400 | $251,600 |
| 2015 | $6,786 | $550,000 | $302,500 | $247,500 |
| 2014 | $6,285 | $502,000 | $276,100 | $225,900 |
Source: Public Records
Map
Nearby Homes
- 7821 Santa Theresa Dr
- 704 Tennyson Dr
- 60 Monte Vista Way
- 622 Broadway
- 620 Broadway
- 626 Broadway
- 7681 Hanna St
- 7490 Santa Theresa Dr Unit 10
- 7460 Miller Ave
- 7630 Hanna St
- 700 Eschenburg Dr
- 925 Blake Ct
- 7691 Church St Unit B
- 7609 Santa Paula Dr
- 7384 Ailes Ct
- 760 Welburn Ave
- 7376 Ailes Ct
- 7360 Ailes Ct
- 7351 Princevalle St Unit Homesite 18
- 194 4th St
Your Personal Tour Guide
Ask me questions while you tour the home.