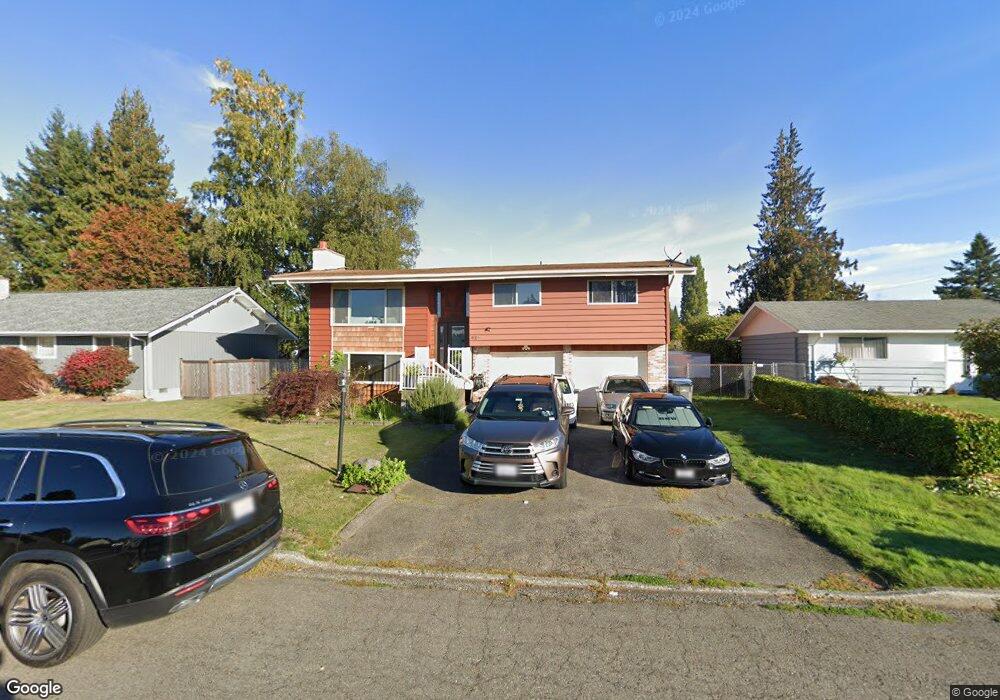
820 E 31st St Bremerton, WA 98310
Estimated Value: $487,103 - $524,000
3
Beds
3
Baths
2,080
Sq Ft
$242/Sq Ft
Est. Value
About This Home
This home is located at 820 E 31st St, Bremerton, WA 98310 and is currently estimated at $503,026, approximately $241 per square foot. 820 E 31st St is a home located in Kitsap County with nearby schools including Armin Jahr Elementary School, Mountain View Middle School, and Bremerton High School.
Ownership History
Date
Name
Owned For
Owner Type
Purchase Details
Closed on
Nov 21, 2020
Sold by
Hoyer Arlene C and Hoyer Douglas E
Bought by
Helt Brandon Scott and Helt Kimberly
Current Estimated Value
Home Financials for this Owner
Home Financials are based on the most recent Mortgage that was taken out on this home.
Original Mortgage
$394,716
Outstanding Balance
$351,241
Interest Rate
2.8%
Mortgage Type
VA
Estimated Equity
$151,785
Purchase Details
Closed on
Mar 11, 2019
Sold by
Hoyer Arlene C
Bought by
Hoyer Arlene C and Hoyer Douglas E
Purchase Details
Closed on
Mar 21, 1969
Sold by
Rasmussen Delma
Bought by
Hoyer Robert C and Hoyer Patricia E
Home Financials for this Owner
Home Financials are based on the most recent Mortgage that was taken out on this home.
Original Mortgage
$10,000
Interest Rate
7.66%
Create a Home Valuation Report for This Property
The Home Valuation Report is an in-depth analysis detailing your home's value as well as a comparison with similar homes in the area
Home Values in the Area
Average Home Value in this Area
Purchase History
| Date | Buyer | Sale Price | Title Company |
|---|---|---|---|
| Helt Brandon Scott | $381,000 | Fidelity National Title | |
| Hoyer Arlene C | -- | Accommodation | |
| Hoyer Robert C | -- | Pacific Nw Title |
Source: Public Records
Mortgage History
| Date | Status | Borrower | Loan Amount |
|---|---|---|---|
| Open | Helt Brandon Scott | $394,716 | |
| Previous Owner | Hoyer Robert C | $10,000 |
Source: Public Records
Tax History Compared to Growth
Tax History
| Year | Tax Paid | Tax Assessment Tax Assessment Total Assessment is a certain percentage of the fair market value that is determined by local assessors to be the total taxable value of land and additions on the property. | Land | Improvement |
|---|---|---|---|---|
| 2026 | $3,911 | $453,410 | $101,440 | $351,970 |
| 2025 | $3,911 | $453,410 | $101,440 | $351,970 |
| 2024 | $3,772 | $453,410 | $101,440 | $351,970 |
| 2023 | $3,900 | $453,410 | $101,440 | $351,970 |
| 2022 | $3,610 | $377,840 | $84,530 | $293,310 |
| 2021 | $3,772 | $361,460 | $56,340 | $305,120 |
| 2020 | $3,527 | $338,260 | $52,540 | $285,720 |
| 2019 | $3,057 | $304,710 | $47,210 | $257,500 |
| 2018 | $3,370 | $232,900 | $38,070 | $194,830 |
| 2017 | $2,967 | $232,900 | $38,070 | $194,830 |
| 2016 | $2,779 | $206,630 | $33,390 | $173,240 |
| 2015 | $2,532 | $187,370 | $33,820 | $153,550 |
| 2014 | -- | $179,120 | $33,820 | $145,300 |
| 2013 | -- | $191,400 | $36,200 | $155,200 |
Source: Public Records
Map
Nearby Homes
- 920 E 31st St
- 654 E 31st St
- 944 E 30th St
- 3221 Solie Ave
- 2916 Robin Ave
- 2824 Robin Ave
- 3001 Wheaton Way
- 414 E 31st St
- 2861 Clare Ave
- 2853 Clare Ave
- 212 Willow St
- 937 Pearl St
- 213 Willow St
- 2727 Hefner Ave
- 3023 Pawnee Dr
- 3621 Wheaton Way
- 1413 Lindberg Place
- 802 Hanford Ave
- 2765 Clare Ave Unit 3
- 567 Juniper St