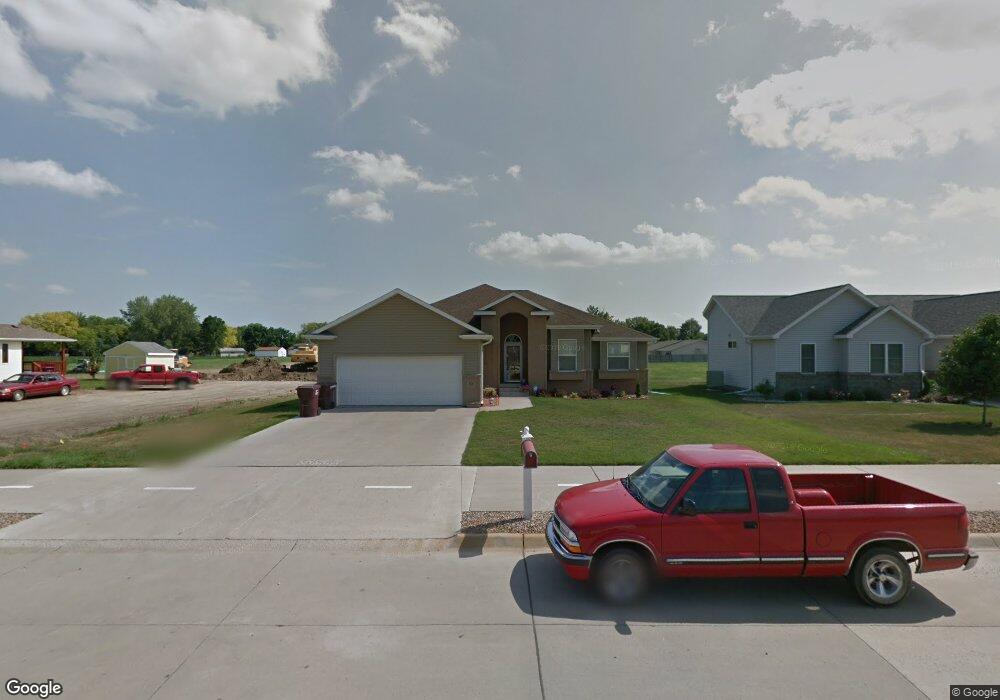
820 E 31st St South Sioux City, NE 68776
Estimated Value: $291,000 - $404,000
3
Beds
2
Baths
1,744
Sq Ft
$203/Sq Ft
Est. Value
About This Home
This home is located at 820 E 31st St, South Sioux City, NE 68776 and is currently estimated at $353,541, approximately $202 per square foot. 820 E 31st St is a home located in Dakota County with nearby schools including Cardinal Elementary School, South Sioux City Middle School, and South Sioux Senior High School.
Ownership History
Date
Name
Owned For
Owner Type
Purchase Details
Closed on
Sep 29, 2017
Sold by
Saengthammavong Kai and Kassing Nicole
Bought by
Saengthammavong Kai
Current Estimated Value
Purchase Details
Closed on
Oct 31, 2008
Sold by
Matney Edward H and Verschoor Matney Lisa
Bought by
Saengthammavong Kai and Kassing Nicole
Home Financials for this Owner
Home Financials are based on the most recent Mortgage that was taken out on this home.
Original Mortgage
$169,960
Interest Rate
6%
Mortgage Type
Adjustable Rate Mortgage/ARM
Create a Home Valuation Report for This Property
The Home Valuation Report is an in-depth analysis detailing your home's value as well as a comparison with similar homes in the area
Home Values in the Area
Average Home Value in this Area
Purchase History
| Date | Buyer | Sale Price | Title Company |
|---|---|---|---|
| Saengthammavong Kai | $40,000 | None Available | |
| Saengthammavong Kai | $213,000 | -- |
Source: Public Records
Mortgage History
| Date | Status | Borrower | Loan Amount |
|---|---|---|---|
| Previous Owner | Saengthammavong Kai | $169,960 |
Source: Public Records
Tax History Compared to Growth
Tax History
| Year | Tax Paid | Tax Assessment Tax Assessment Total Assessment is a certain percentage of the fair market value that is determined by local assessors to be the total taxable value of land and additions on the property. | Land | Improvement |
|---|---|---|---|---|
| 2024 | $3,305 | $259,840 | $23,405 | $236,435 |
| 2023 | $4,662 | $262,565 | $22,505 | $240,060 |
| 2022 | $4,106 | $214,720 | $22,505 | $192,215 |
| 2021 | $4,256 | $214,720 | $22,505 | $192,215 |
| 2020 | $4,219 | $211,025 | $22,505 | $188,520 |
| 2019 | $4,273 | $213,120 | $22,505 | $190,615 |
| 2018 | $4,309 | $213,120 | $22,505 | $190,615 |
| 2017 | $4,311 | $213,725 | $22,505 | $191,220 |
| 2016 | $4,149 | $209,220 | $18,000 | $191,220 |
| 2014 | $3,817 | $185,405 | $30,000 | $155,405 |
Source: Public Records
Map
Nearby Homes