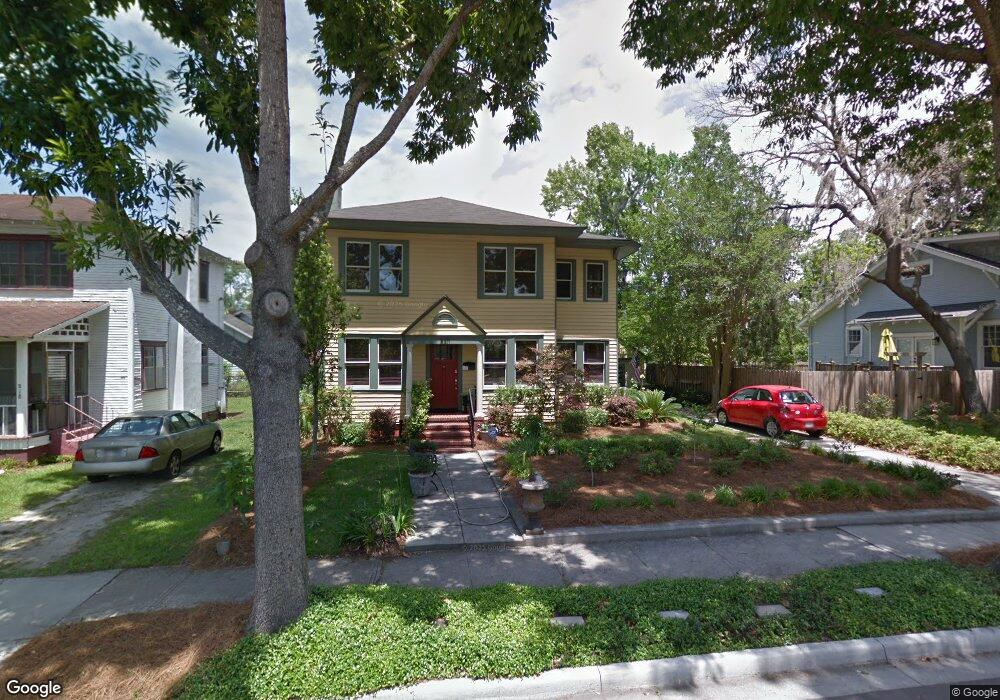
820 E 40th St Savannah, GA 31401
Midtown Savannah NeighborhoodEstimated Value: $425,948 - $623,000
3
Beds
3
Baths
2,023
Sq Ft
$271/Sq Ft
Est. Value
About This Home
This home is located at 820 E 40th St, Savannah, GA 31401 and is currently estimated at $547,737, approximately $270 per square foot. 820 E 40th St is a home located in Chatham County with nearby schools including Shuman Elementary School, Hubert Middle School, and Savannah Arts Academy.
Ownership History
Date
Name
Owned For
Owner Type
Purchase Details
Closed on
May 17, 2022
Sold by
Cleaveland Michael S
Bought by
Cleaveland Michael S and Carpentino Christopher James
Current Estimated Value
Purchase Details
Closed on
Dec 17, 2008
Sold by
Not Provided
Bought by
Cleavland Michael S
Home Financials for this Owner
Home Financials are based on the most recent Mortgage that was taken out on this home.
Original Mortgage
$172,500
Interest Rate
5.96%
Mortgage Type
New Conventional
Purchase Details
Closed on
Aug 2, 2004
Sold by
Morris Jimmy
Bought by
Morris Jimmy and Miltiades Helen
Create a Home Valuation Report for This Property
The Home Valuation Report is an in-depth analysis detailing your home's value as well as a comparison with similar homes in the area
Home Values in the Area
Average Home Value in this Area
Purchase History
| Date | Buyer | Sale Price | Title Company |
|---|---|---|---|
| Cleaveland Michael S | -- | -- | |
| Cleavland Michael S | $192,500 | -- | |
| Morris Jimmy | -- | -- |
Source: Public Records
Mortgage History
| Date | Status | Borrower | Loan Amount |
|---|---|---|---|
| Previous Owner | Cleavland Michael S | $172,500 |
Source: Public Records
Tax History
| Year | Tax Paid | Tax Assessment Tax Assessment Total Assessment is a certain percentage of the fair market value that is determined by local assessors to be the total taxable value of land and additions on the property. | Land | Improvement |
|---|---|---|---|---|
| 2025 | $2,217 | $157,080 | $41,600 | $115,480 |
| 2024 | $16 | $132,360 | $41,600 | $90,760 |
| 2023 | $872 | $141,800 | $41,600 | $100,200 |
| 2022 | $2,041 | $116,880 | $28,000 | $88,880 |
| 2021 | $3,022 | $98,800 | $20,000 | $78,800 |
| 2020 | $2,045 | $97,200 | $20,000 | $77,200 |
| 2019 | $3,019 | $97,200 | $20,000 | $77,200 |
| 2018 | $3,015 | $77,280 | $20,000 | $57,280 |
| 2017 | $2,706 | $78,840 | $19,800 | $59,040 |
| 2016 | $1,798 | $72,800 | $19,800 | $53,000 |
| 2015 | $2,620 | $68,880 | $19,800 | $49,080 |
| 2014 | $3,485 | $75,720 | $0 | $0 |
Source: Public Records
Map
Nearby Homes
Your Personal Tour Guide
Ask me questions while you tour the home.