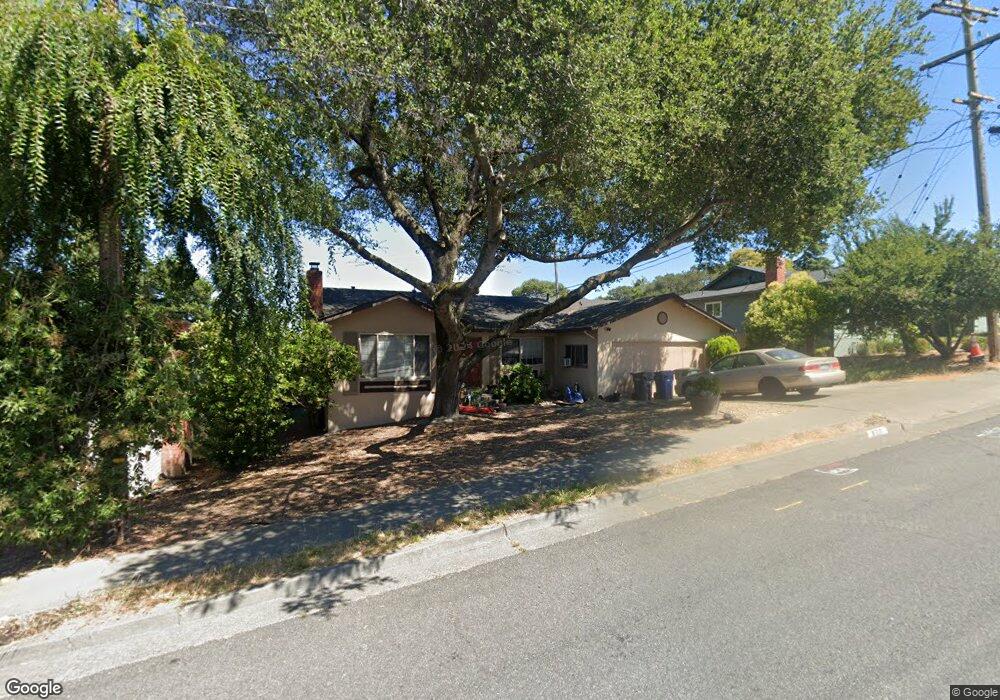
820 Elm Dr Petaluma, CA 94952
Oakhill Brewster NeighborhoodEstimated Value: $829,574 - $990,000
4
Beds
2
Baths
1,338
Sq Ft
$681/Sq Ft
Est. Value
About This Home
This home is located at 820 Elm Dr, Petaluma, CA 94952 and is currently estimated at $910,644, approximately $680 per square foot. 820 Elm Dr is a home located in Sonoma County with nearby schools including McKinley Elementary School, Petaluma Junior High School, and Petaluma High School.
Ownership History
Date
Name
Owned For
Owner Type
Purchase Details
Closed on
Oct 15, 2021
Sold by
Goldman Ben E and Goldman Connie G
Bought by
Goldman Ben E and Goldman Connie G
Current Estimated Value
Purchase Details
Closed on
Jun 10, 1996
Sold by
Dubin Robert L and Dubin Re
Bought by
Goldman Ben E and Goldman Connie G
Home Financials for this Owner
Home Financials are based on the most recent Mortgage that was taken out on this home.
Original Mortgage
$181,600
Outstanding Balance
$11,613
Interest Rate
8.01%
Estimated Equity
$899,031
Purchase Details
Closed on
Feb 10, 1994
Sold by
Dubin Robert L and Dubin Re
Bought by
Dubin Robert L and Dubin Re
Home Financials for this Owner
Home Financials are based on the most recent Mortgage that was taken out on this home.
Original Mortgage
$156,000
Interest Rate
7.24%
Create a Home Valuation Report for This Property
The Home Valuation Report is an in-depth analysis detailing your home's value as well as a comparison with similar homes in the area
Home Values in the Area
Average Home Value in this Area
Purchase History
| Date | Buyer | Sale Price | Title Company |
|---|---|---|---|
| Goldman Ben E | -- | None Available | |
| Goldman Ben E | $227,000 | First American Title | |
| Dubin Robert L | -- | North Bay Title Co |
Source: Public Records
Mortgage History
| Date | Status | Borrower | Loan Amount |
|---|---|---|---|
| Open | Goldman Ben E | $181,600 | |
| Previous Owner | Dubin Robert L | $156,000 |
Source: Public Records
Tax History Compared to Growth
Tax History
| Year | Tax Paid | Tax Assessment Tax Assessment Total Assessment is a certain percentage of the fair market value that is determined by local assessors to be the total taxable value of land and additions on the property. | Land | Improvement |
|---|---|---|---|---|
| 2025 | $4,128 | $377,636 | $182,994 | $194,642 |
| 2024 | $4,128 | $370,232 | $179,406 | $190,826 |
| 2023 | $4,128 | $362,974 | $175,889 | $187,085 |
| 2022 | $3,957 | $355,858 | $172,441 | $183,417 |
| 2021 | $3,882 | $348,881 | $169,060 | $179,821 |
| 2020 | $3,914 | $345,305 | $167,327 | $177,978 |
| 2019 | $3,866 | $338,536 | $164,047 | $174,489 |
| 2018 | $3,850 | $331,899 | $160,831 | $171,068 |
| 2017 | $3,769 | $325,392 | $157,678 | $167,714 |
| 2016 | $3,675 | $319,013 | $154,587 | $164,426 |
| 2015 | $3,624 | $314,222 | $152,265 | $161,957 |
| 2014 | $3,605 | $308,068 | $149,283 | $158,785 |
Source: Public Records
Map
Nearby Homes
- 1 Kazen Way
- 1375 Gossage Ave
- 495 Cherry St
- 1105 West St
- 513 Larch Dr
- 509 Larch Dr
- 125 Acorn Dr
- 304 West St
- 13 Fowler Ct
- 26 Wallace Ct
- 12 Dorenfeld Ct
- 13 Dorenfeld Ct
- 505 Petaluma Blvd N
- 1252 Petaluma Blvd N
- 331 Keller St Unit 11
- 1060 Lohrman Ln
- 673 Lohrman Ln
- 210 Keller St
- 136 Court St
- Plan 3 Craftsman at Riverbend Petaluma - Wine Country Collection