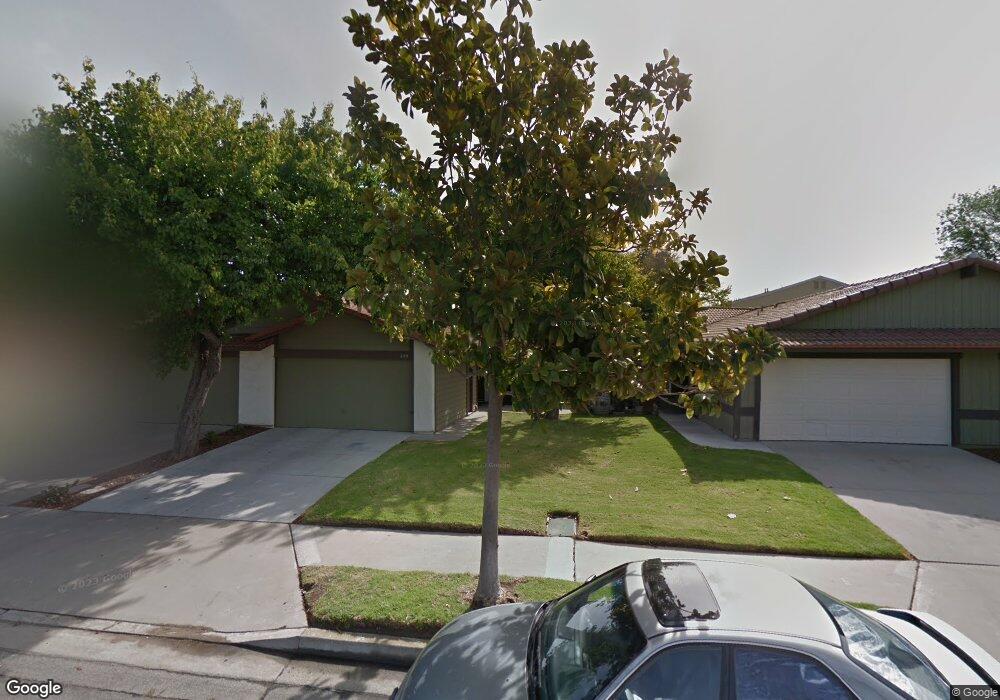
820 N L St Unit 5 Lompoc, CA 93436
Estimated Value: $374,509 - $395,000
2
Beds
2
Baths
952
Sq Ft
$404/Sq Ft
Est. Value
About This Home
This home is located at 820 N L St Unit 5, Lompoc, CA 93436 and is currently estimated at $384,627, approximately $404 per square foot. 820 N L St Unit 5 is a home located in Santa Barbara County with nearby schools including La Canada Elementary School, Lompoc Valley Middle School, and Lompoc High School.
Ownership History
Date
Name
Owned For
Owner Type
Purchase Details
Closed on
Dec 30, 2025
Sold by
Signorelli Charles G and Signorelli Chad T
Bought by
Signorelli Family Enterprises A Llc
Current Estimated Value
Purchase Details
Closed on
Nov 12, 2015
Sold by
Signorelli Family Enterprises Llc
Bought by
Signorelli Frank M
Purchase Details
Closed on
Aug 21, 2006
Sold by
Signorelli Frank M
Bought by
Signorelli Family Enterprises Llc
Purchase Details
Closed on
Dec 21, 2005
Sold by
Signorelli Frank M
Bought by
Signorelli Charles G and Signorelli Christopher M
Purchase Details
Closed on
Jul 19, 1996
Sold by
Lopez Manuel and Lopez Jennifer L
Bought by
Lopez Cristina
Home Financials for this Owner
Home Financials are based on the most recent Mortgage that was taken out on this home.
Original Mortgage
$89,760
Interest Rate
8.42%
Mortgage Type
VA
Create a Home Valuation Report for This Property
The Home Valuation Report is an in-depth analysis detailing your home's value as well as a comparison with similar homes in the area
Home Values in the Area
Average Home Value in this Area
Purchase History
| Date | Buyer | Sale Price | Title Company |
|---|---|---|---|
| Signorelli Family Enterprises A Llc | -- | None Listed On Document | |
| Signorelli Frank M | -- | None Available | |
| Signorelli Family Enterprises Llc | -- | None Available | |
| Signorelli Charles G | -- | None Available | |
| Signorelli Charles G | -- | -- | |
| Lopez Cristina | $88,000 | Chicago Title Co |
Source: Public Records
Mortgage History
| Date | Status | Borrower | Loan Amount |
|---|---|---|---|
| Previous Owner | Lopez Cristina | $89,760 |
Source: Public Records
Tax History
| Year | Tax Paid | Tax Assessment Tax Assessment Total Assessment is a certain percentage of the fair market value that is determined by local assessors to be the total taxable value of land and additions on the property. | Land | Improvement |
|---|---|---|---|---|
| 2025 | $1,487 | $134,821 | $42,623 | $92,198 |
| 2023 | $1,487 | $117,509 | $37,659 | $79,850 |
| 2022 | $1,328 | $115,206 | $36,921 | $78,285 |
| 2021 | $1,341 | $112,948 | $36,198 | $76,750 |
| 2020 | $1,328 | $111,791 | $35,827 | $75,964 |
| 2019 | $1,305 | $109,600 | $35,125 | $74,475 |
| 2018 | $1,285 | $107,452 | $34,437 | $73,015 |
| 2017 | $1,261 | $105,346 | $33,762 | $71,584 |
| 2016 | $1,239 | $103,281 | $33,100 | $70,181 |
| 2015 | $1,229 | $101,730 | $32,603 | $69,127 |
| 2014 | $1,212 | $99,738 | $31,965 | $67,773 |
Source: Public Records
Map
Nearby Homes
- 923 N N Place
- 526 N L St
- 510 N I St
- 1257 Stonebrook Dr
- 1248 Stonebrook Dr
- 1309 Stonebrook Dr
- 317 E Prune Ave
- 1249 Westbrook Dr
- 1213 Iris Ct
- 812 N D St
- 1212 Timothy Ct
- 610 E Pine Ave Unit 10
- 610 E Pine Ave Unit 62
- 610 E Pine Ave Unit 77
- 516 N U St
- 701 E Pine Ave Unit 161
- 701 E Pine Ave Unit 176
- 1444 Village Meadows Dr
- 1407 N H St
- 1513 W Lemon Ave
Your Personal Tour Guide
Ask me questions while you tour the home.