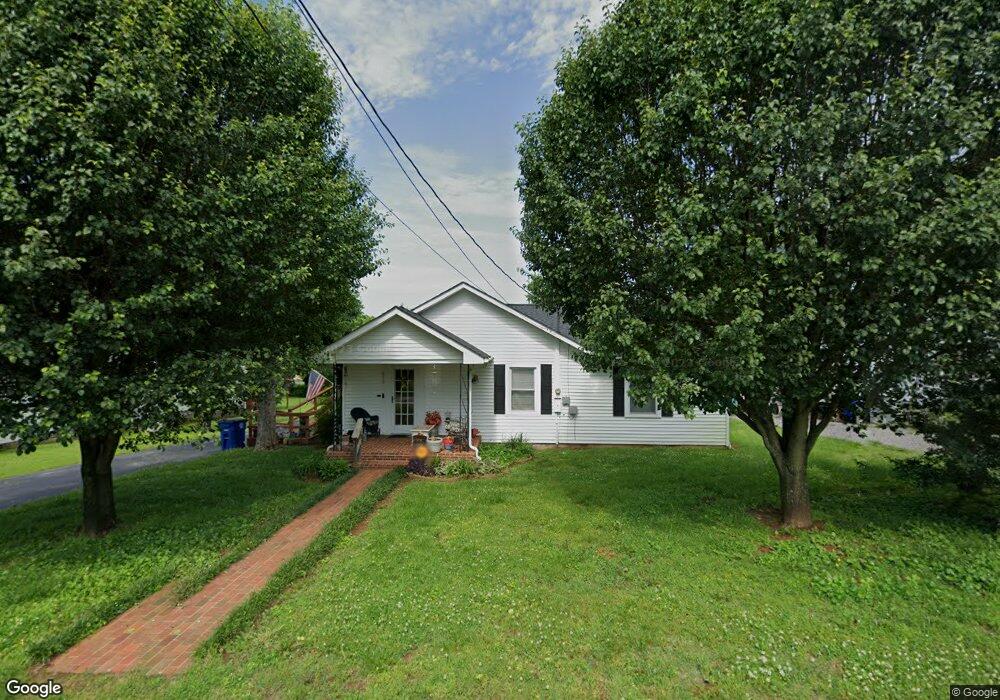
820 Shelbyview Dr Shelbyville, TN 37160
Estimated Value: $217,774 - $326,000
--
Bed
2
Baths
2,042
Sq Ft
$139/Sq Ft
Est. Value
About This Home
This home is located at 820 Shelbyview Dr, Shelbyville, TN 37160 and is currently estimated at $283,944, approximately $139 per square foot. 820 Shelbyview Dr is a home located in Bedford County with nearby schools including South Side Elementary School, Harris Middle School, and Christian Chapel Academy.
Ownership History
Date
Name
Owned For
Owner Type
Purchase Details
Closed on
Oct 5, 2018
Sold by
Cook Patricia L and Cook Albert B
Bought by
Cook Albert Bryan
Current Estimated Value
Home Financials for this Owner
Home Financials are based on the most recent Mortgage that was taken out on this home.
Original Mortgage
$37,500
Outstanding Balance
$23,092
Interest Rate
4.5%
Mortgage Type
New Conventional
Estimated Equity
$260,852
Purchase Details
Closed on
Sep 19, 2016
Sold by
Cook Patricia L
Bought by
Cook Patricia L and Cook Albert B
Purchase Details
Closed on
Jul 28, 1998
Sold by
Smotherman Charles H
Bought by
Cook Albert H and Cook Patricia
Purchase Details
Closed on
Apr 29, 1994
Sold by
Harrison Modena M
Bought by
Smotherman Charles H
Purchase Details
Closed on
Nov 2, 1968
Bought by
Pickle Sam Mrs
Create a Home Valuation Report for This Property
The Home Valuation Report is an in-depth analysis detailing your home's value as well as a comparison with similar homes in the area
Home Values in the Area
Average Home Value in this Area
Purchase History
| Date | Buyer | Sale Price | Title Company |
|---|---|---|---|
| Cook Albert Bryan | -- | Waterstone Title | |
| Cook Patricia L | -- | -- | |
| Cook Albert H | $64,000 | -- | |
| Smotherman Charles H | -- | -- | |
| Pickle Sam Mrs | -- | -- |
Source: Public Records
Mortgage History
| Date | Status | Borrower | Loan Amount |
|---|---|---|---|
| Open | Cook Albert Bryan | $37,500 |
Source: Public Records
Tax History Compared to Growth
Tax History
| Year | Tax Paid | Tax Assessment Tax Assessment Total Assessment is a certain percentage of the fair market value that is determined by local assessors to be the total taxable value of land and additions on the property. | Land | Improvement |
|---|---|---|---|---|
| 2025 | -- | $40,200 | $0 | $0 |
| 2024 | -- | $40,200 | $6,250 | $33,950 |
| 2023 | $1,530 | $40,200 | $6,250 | $33,950 |
| 2022 | $1,574 | $40,200 | $6,250 | $33,950 |
| 2021 | $1,429 | $40,200 | $6,250 | $33,950 |
| 2020 | $967 | $40,200 | $6,250 | $33,950 |
| 2019 | $967 | $21,825 | $2,750 | $19,075 |
| 2018 | $945 | $21,825 | $2,750 | $19,075 |
| 2017 | $945 | $21,825 | $2,750 | $19,075 |
| 2016 | $936 | $21,825 | $2,750 | $19,075 |
| 2015 | $936 | $21,825 | $2,750 | $19,075 |
| 2014 | $645 | $16,448 | $0 | $0 |
Source: Public Records
Map
Nearby Homes
- 822 Shelbyview Dr
- 818 Shelbyview Dr
- 900 Shelbyview Dr
- 816 Shelbyview Dr
- 111 Burrum Dr
- 109 Burrum Dr
- 821 Shelbyview Dr
- 819 Shelbyview Dr
- 113 Burrum Dr
- 107 Burrum Dr
- 814 Shelbyview Dr
- 902 Shelbyview Dr
- 505 Ivie Ave
- 115 Burrum Dr
- 817 Shelbyview Dr
- 903 Shelbyview Dr
- 105 Burrum Dr
- 904 Shelbyview Dr
- 812 Shelbyview Dr
- 112 Burrum Dr