8200 Bertson Place Columbus, OH 43235
Village at Worthington NeighborhoodEstimated Value: $402,000 - $446,000
3
Beds
2
Baths
1,604
Sq Ft
$267/Sq Ft
Est. Value
About This Home
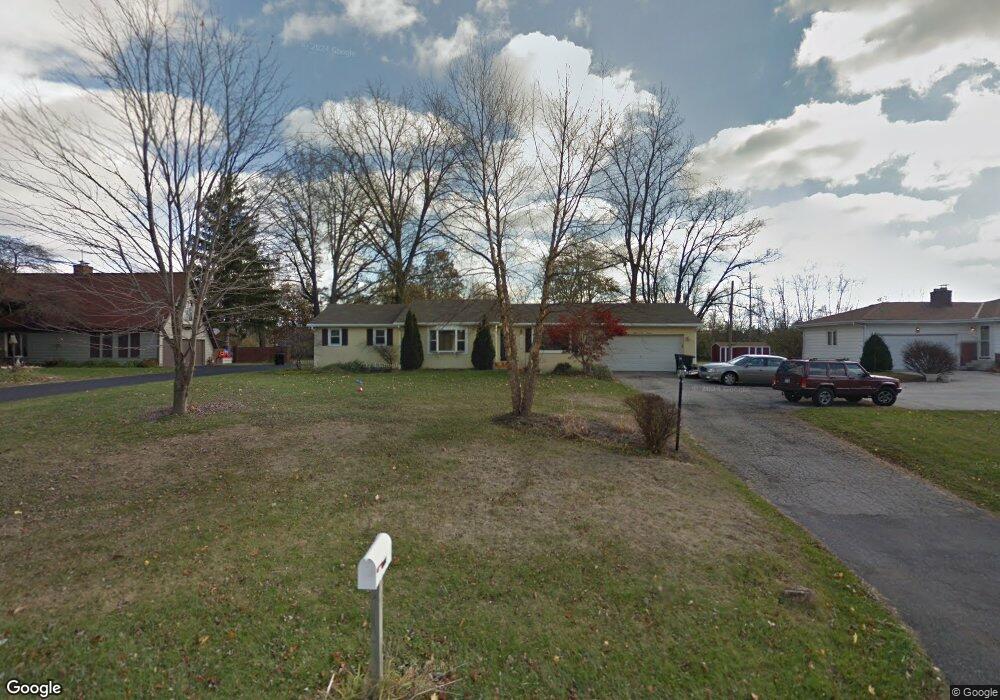
This home is located at 8200 Bertson Place, Columbus, OH 43235 and is currently estimated at $427,760, approximately $266 per square foot. 8200 Bertson Place is a home located in Franklin County with nearby schools including Worthington Estates Elementary School, Worthingway Middle School, and Thomas Worthington High School.
Ownership History
Date
Name
Owned For
Owner Type
Purchase Details
Closed on
Dec 24, 2003
Sold by
Mccaulley Board Mary L and Board Leander
Bought by
Hawkins Roderick and Hawkins Suzanne H
Current Estimated Value
Home Financials for this Owner
Home Financials are based on the most recent Mortgage that was taken out on this home.
Original Mortgage
$130,150
Outstanding Balance
$61,247
Interest Rate
6.45%
Mortgage Type
Purchase Money Mortgage
Estimated Equity
$366,513
Purchase Details
Closed on
Jul 27, 2001
Sold by
Tellimar Enterprises Llc
Bought by
Mccaulley Mary L
Home Financials for this Owner
Home Financials are based on the most recent Mortgage that was taken out on this home.
Original Mortgage
$105,000
Interest Rate
11.5%
Mortgage Type
Purchase Money Mortgage
Purchase Details
Closed on
May 16, 2000
Sold by
Washington Robin C and Estate Of Fred C Johnson
Bought by
Tellimar Enterprises Llc
Purchase Details
Closed on
Oct 8, 1963
Bought by
Johnson Fred C
Create a Home Valuation Report for This Property
The Home Valuation Report is an in-depth analysis detailing your home's value as well as a comparison with similar homes in the area
Home Values in the Area
Average Home Value in this Area
Purchase History
| Date | Buyer | Sale Price | Title Company |
|---|---|---|---|
| Hawkins Roderick | $137,000 | Chelsea Title Agency | |
| Mccaulley Mary L | $150,000 | -- | |
| Tellimar Enterprises Llc | $70,000 | Chicago Title | |
| Johnson Fred C | -- | -- |
Source: Public Records
Mortgage History
| Date | Status | Borrower | Loan Amount |
|---|---|---|---|
| Open | Hawkins Roderick | $130,150 | |
| Previous Owner | Mccaulley Mary L | $105,000 |
Source: Public Records
Tax History
| Year | Tax Paid | Tax Assessment Tax Assessment Total Assessment is a certain percentage of the fair market value that is determined by local assessors to be the total taxable value of land and additions on the property. | Land | Improvement |
|---|---|---|---|---|
| 2025 | $9,184 | $126,010 | $50,300 | $75,710 |
| 2024 | $9,184 | $126,010 | $50,300 | $75,710 |
| 2023 | $10,840 | $154,595 | $99,295 | $55,300 |
| 2022 | $5,840 | $68,430 | $22,120 | $46,310 |
| 2021 | $5,448 | $68,430 | $22,120 | $46,310 |
| 2020 | $5,276 | $68,430 | $22,120 | $46,310 |
| 2019 | $5,181 | $59,500 | $19,250 | $40,250 |
| 2018 | $4,554 | $59,500 | $19,250 | $40,250 |
| 2017 | $5,284 | $82,110 | $34,300 | $47,810 |
| 2016 | $4,062 | $48,130 | $12,600 | $35,530 |
| 2015 | $4,063 | $48,130 | $12,600 | $35,530 |
| 2014 | $4,061 | $48,130 | $12,600 | $35,530 |
| 2013 | $2,040 | $48,125 | $12,600 | $35,525 |
Source: Public Records
Map
Nearby Homes
- 8050 Flint Run Place Unit 8050
- 297 Cover Place Unit 297
- 8058 Flint Rd
- 8176 Lake Bluff Ct
- 117 Lake Bluff Dr
- 757 Summertree Ln
- 101 Lake Bluff Dr
- 8536 Lazelle Village Dr Unit 8536
- 7784 Leaview Dr
- 336 Brownsfell Dr
- 870 Philadelphia Dr Unit 23F
- 8572 Fernbrook Dr
- 7853 Barkwood Dr Unit 18C
- 93 Forest Ridge Ct
- 67 Highland Pointe Cir Unit 67
- 8318 Linton Blvd Unit 8318
- 579 Mawyer Dr Unit 168
- 8726 Woodwind Dr
- 337 Holly Grove Rd
- 8041 Lakeloop Dr Unit 8041
- 8208 Bertson Place
- 8192 Bertson Place
- 8216 Bertson Place
- 8199 Bertson Place
- 200 Melyers Ct
- 8207 Bertson Place
- 8176 Bertson Place
- 8176 Berston Place
- 8217 Bertson Place
- 192 Melyers Ct
- 8168 Bertson Place
- 201 Melyers Ct
- 8225 Bertson Place
- 8220 Flint Rd
- 184 Melyers Ct
- 191 Melyers Ct
- 8240 Bertson Place
- 8194 Flint Rd
- 8200 Flint Rd
- 183 Melyers Ct
Your Personal Tour Guide
Ask me questions while you tour the home.