Estimated Value: $321,000 - $347,000
3
Beds
7
Baths
1,592
Sq Ft
$207/Sq Ft
Est. Value
About This Home
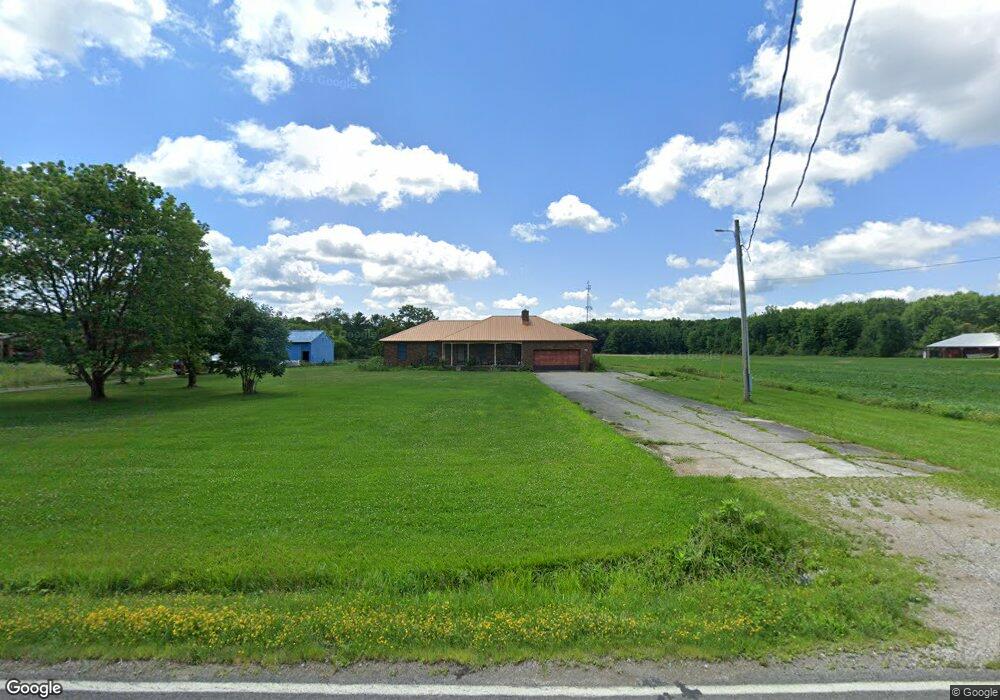
This home is located at 8200 Chippewa Rd, Lodi, OH 44254 and is currently estimated at $329,984, approximately $207 per square foot. 8200 Chippewa Rd is a home with nearby schools including Cloverleaf Elementary School, Cloverleaf Middle School, and Cloverleaf High School.
Ownership History
Date
Name
Owned For
Owner Type
Purchase Details
Closed on
Nov 21, 2012
Sold by
Wellman Alvis and Wellman Margaret A
Bought by
Wellman Douglas
Current Estimated Value
Purchase Details
Closed on
Nov 19, 2012
Sold by
Wellman Alvis and Wellman Margaret A
Bought by
Wellman Douglas
Purchase Details
Closed on
Nov 23, 2004
Sold by
Wellman Alvis and Wellman Margaret A
Bought by
Salsgiver Bruce
Create a Home Valuation Report for This Property
The Home Valuation Report is an in-depth analysis detailing your home's value as well as a comparison with similar homes in the area
Purchase History
| Date | Buyer | Sale Price | Title Company |
|---|---|---|---|
| Wellman Douglas | -- | -- | |
| Wellman Douglas | -- | None Available | |
| Salsgiver Bruce | -- | -- | |
| Wellman Alvis | -- | -- |
Source: Public Records
Tax History
| Year | Tax Paid | Tax Assessment Tax Assessment Total Assessment is a certain percentage of the fair market value that is determined by local assessors to be the total taxable value of land and additions on the property. | Land | Improvement |
|---|---|---|---|---|
| 2024 | $3,573 | $85,370 | $25,960 | $59,410 |
| 2023 | $3,214 | $85,370 | $25,960 | $59,410 |
| 2022 | $3,309 | $85,370 | $25,960 | $59,410 |
| 2021 | $2,810 | $66,180 | $20,130 | $46,050 |
| 2020 | $2,863 | $66,180 | $20,130 | $46,050 |
| 2019 | $2,880 | $66,180 | $20,130 | $46,050 |
| 2018 | $3,506 | $54,390 | $17,970 | $36,420 |
| 2017 | $2,150 | $54,390 | $17,970 | $36,420 |
| 2016 | $2,166 | $54,390 | $17,970 | $36,420 |
| 2015 | $2,220 | $54,390 | $17,970 | $36,420 |
| 2014 | $2,211 | $54,390 | $17,970 | $36,420 |
| 2013 | $2,049 | $54,390 | $17,970 | $36,420 |
Source: Public Records
Map
Nearby Homes
- 7318 Friendsville Rd
- 8123 Vandemark Rd
- 2769 Weeping Pine Dr
- 2770 Weeping Pine Dr
- 547 Creek Bend Trail
- 7914 Buffham Rd
- 8504 Lafayette Rd
- 720 Medina St
- 0 Chatham Rd Unit 5188074
- 5717 Vandemark Rd
- 0 Ballash Rd Unit 5189900
- Parcel B Chippewa Rd
- 7595 Kings Creek Dr
- 0 Shaw Rd Unit 5168184
- 37 Buffham Rd
- 0 Greenwich Rd Unit 5170888
- 9900 Chatham Rd
- 8848 Westfield Rd
- 537 Lee Lore Dr
- 120 Sunset Unit 31
- 8205 Chippewa Rd
- 8243 Chippewa Rd
- 8252 Chippewa Rd
- 8274 Chippewa Rd
- 8295 Chippewa Rd
- 8130 Chippewa Rd
- V/L Chippewa Rd
- 8044 Chippewa Rd
- 8035 Chippewa Rd
- 8030 Chippewa Rd
- 8366 Chippewa Rd
- 8041 Chippewa Rd
- 7989 Chippewa Rd
- 7966 Chippewa Rd
- 7938 Chippewa Rd
- 7900 Chippewa Rd
- 8475 Chippewa Rd
- 8205 Rodgers Rd
- 7880 Chippewa Rd
- 8495 Chippewa Rd
Your Personal Tour Guide
Ask me questions while you tour the home.